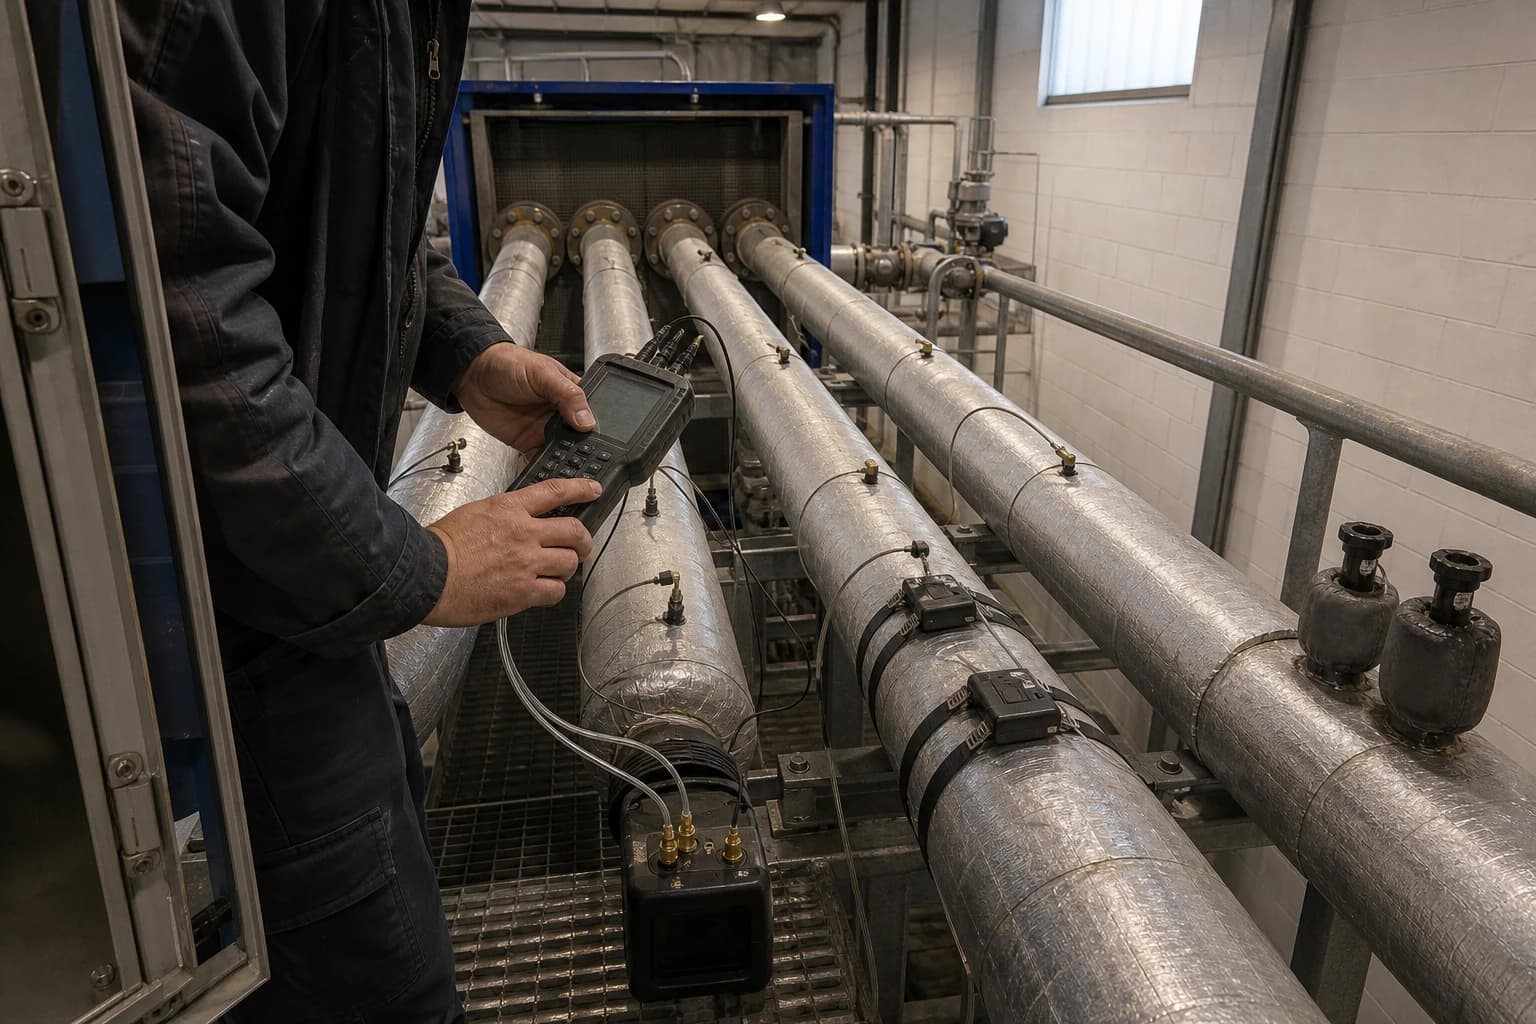
Heat Exchanger Efficiency Testing Finds Fouling Losses
Measure U-value, heat-transfer rate and pressure drop to prioritise cleaning.
Heat exchanger efficiency testing measures heat duty, overall heat-transfer coefficient and pressure drop to determine whether an exchanger still delivers its required thermal performance. A cooler that misses its outlet temperature during a summer production run, or a heat-recovery exchanger that leaves a process stream hotter than expected, can signal lost capacity and additional utility demand long before an alarm reaches its limit.
ASME PTC 12.5-2000 (R2025) provides a structured basis for testing single-phase heat exchangers. It focuses on heat-transfer rate, overall heat-transfer coefficient and nozzle-to-nozzle pressure loss. These measures turn a vague concern about poor performance into evidence that maintenance and energy teams can use.
For plant reliability engineers, the task is to distinguish genuine exchanger deterioration from changed operating conditions. A low outlet temperature alone cannot do that. Flow rates, fluid properties, inlet temperatures, bypass positions and pressure loss all affect the result. A sound test accounts for these factors before attributing a loss to fouling.
What Heat Exchanger Efficiency Testing Measures
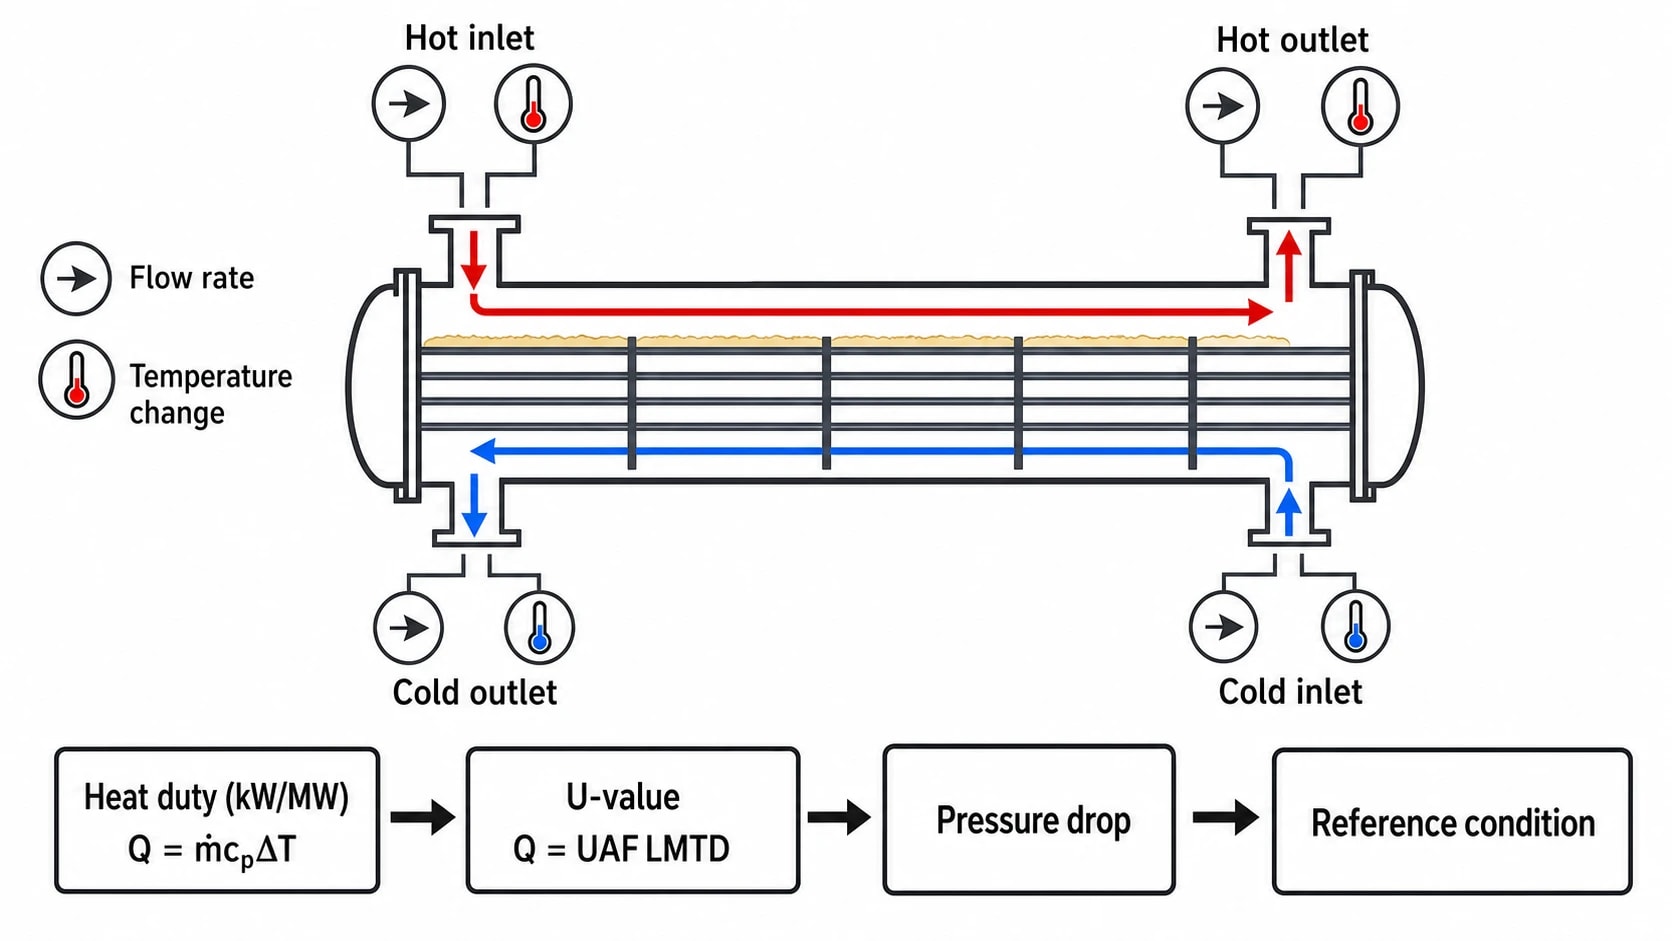
Heat exchanger efficiency testing compares measured operating performance with a design condition, a verified clean baseline or another agreed reference condition. The comparison must use equivalent operating conditions, or a documented correction method, to support a maintenance decision.
Heat duty measures transferred energy
Heat duty is the rate at which energy passes from one process stream to another. It is normally reported in kW or MW. For a single-phase liquid or gas stream, engineers establish duty from mass flow, specific heat capacity and measured temperature change.
Q=m˙cpΔTHere, Q is heat duty, m˙ is mass flow rate, cp is specific heat capacity and ΔT is stream temperature change.
A valid test calculates duty independently on both sides of the exchanger. The results should reconcile within the test uncertainty after allowing for known heat losses or gains. A large imbalance can indicate inaccurate flow measurement, poorly located temperature sensors, a transient operating period, an unrecorded bypass or a change in fluid composition.
Heat duty alone does not establish the exchanger’s condition. An exchanger may meet its duty temporarily because operators have increased steam flow, chilled-water flow or the temperature difference across it. The energy penalty can remain hidden unless the test also calculates thermal performance.
The U-value identifies declining thermal performance
The overall heat-transfer coefficient, usually called the U-value, describes the exchanger’s ability to move heat through all resistances between the two streams. It includes the hot-side film, wall material, cold-side film and any deposit layer.
For a fixed exchanger, a reduced U-value means less heat transfer for the same area and temperature driving force. A fall in U-value can result from fouling, but it can also reflect lower flow velocity, increased viscosity, changed pass arrangement, tube plugging, maldistribution or internal bypassing.
The basic relationship is:
Q=UAFLMTDHere, Q is heat duty, U is the overall heat-transfer coefficient, A is heat-transfer area, F is the correction factor for the exchanger flow arrangement and LMTD is the log mean temperature difference.
This relationship explains why a clean-versus-dirty comparison must be normalised. A lower flow rate changes film coefficients. A different inlet temperature changes LMTD. A comparison that ignores these changes can mistake an off-design production run for fouling.
Pressure drop shows the hydraulic penalty
Pressure drop records resistance to flow across the exchanger, measured from inlet nozzle to outlet nozzle. Deposits, blocked channels and partially plugged tubes can increase pressure loss. This can restrict process flow, increase pumping demand and reduce heat transfer by lowering velocity.
Pressure drop is most useful when read with U-value and duty. An exchanger can develop a substantial insulating layer with little pressure-drop change. Conversely, increased pressure loss may arise from a restricted strainer, a partly closed valve, changed pump behaviour or pressure tappings that include adjacent pipework.
Identify where your plant is losing energy and quantify the savings potential — our audits map every heat source, sink, and waste stream in your facility.
How Fouling Appears in Test Results
Fouling is the accumulation of unwanted material on heat-transfer surfaces. Deposits vary by service. Food and beverage systems can develop protein, sugar and mineral deposits. Chemical plants may encounter salts, polymers, coke or corrosion products. Paper and pulp duties can carry fibres, pitch and suspended solids. Pharmaceutical equipment may lose performance through residues that must also be assessed against cleaning and hygiene requirements.
Read U-value and pressure drop together
A single result rarely identifies a failure mechanism. The combined pattern provides a stronger basis for action.
| Measured pattern | Likely interpretation | Next check |
|---|---|---|
| U-value falls and pressure drop rises | Deposits, blockage or tube plugging are plausible | Review cleaning history and plan inspection |
| U-value falls while pressure drop is stable | Fouling remains possible, alongside changed flow, fluid properties, bypassing or air binding | Verify operating configuration and flow measurements |
| U-value is stable while pressure drop rises | Hydraulic restriction may be forming before thermal duty is affected | Check strainers, valves, pump condition and internal passages |
| Duty falls but U-value is stable | The process may have less temperature driving force or lower flow | Compare inlet conditions and production rate |
| Results shift sharply after a process event | The cause may be contamination, a configuration change or poor test data | Repeat the test at steady conditions |
A gradual U-value decline over repeated tests often supports planned intervention before capacity becomes constrained. A sudden step change needs a different response. Plant teams should review product changes, utility disturbances, wash-water quality, valve positions and maintenance activity before deciding that deposits caused the shift.
Fouling affects thermal margin before failure
Exchangers often continue operating after fouling begins because the process retains some thermal margin. Steam pressure may increase. Cooling-water flow may rise. A batch may take longer to reach temperature. Refrigeration equipment may work harder to compensate for a warmer outlet.
These responses mask the underlying loss. They can also make the exchanger appear adequate at a single operating point. Testing exposes the margin consumed by comparing duty and U-value with the agreed reference basis.
For heat-recovery duties, the loss can be material. Less recovery from a hot effluent stream increases the utility demand of an upstream heater or downstream cooling system. The exchanger may still achieve production temperatures while the site consumes more steam, thermal oil, electricity or chilled water.
Deposits and pressure loss do not rise at the same rate
The character of the deposit matters. A uniform scale layer can impose significant thermal resistance while producing modest hydraulic change. Particulate deposits can restrict narrow plate channels or tube bores and create a rapid pressure-loss increase. Deposits sensitive to wall shear may respond to changes in velocity, while hard scale may require a planned cleaning method.
A high pressure drop does not automatically justify chemical cleaning. It may have a hydraulic cause outside the exchanger. Equally, a normal pressure drop does not clear the exchanger of fouling.
Setting a Defensible Reference Condition
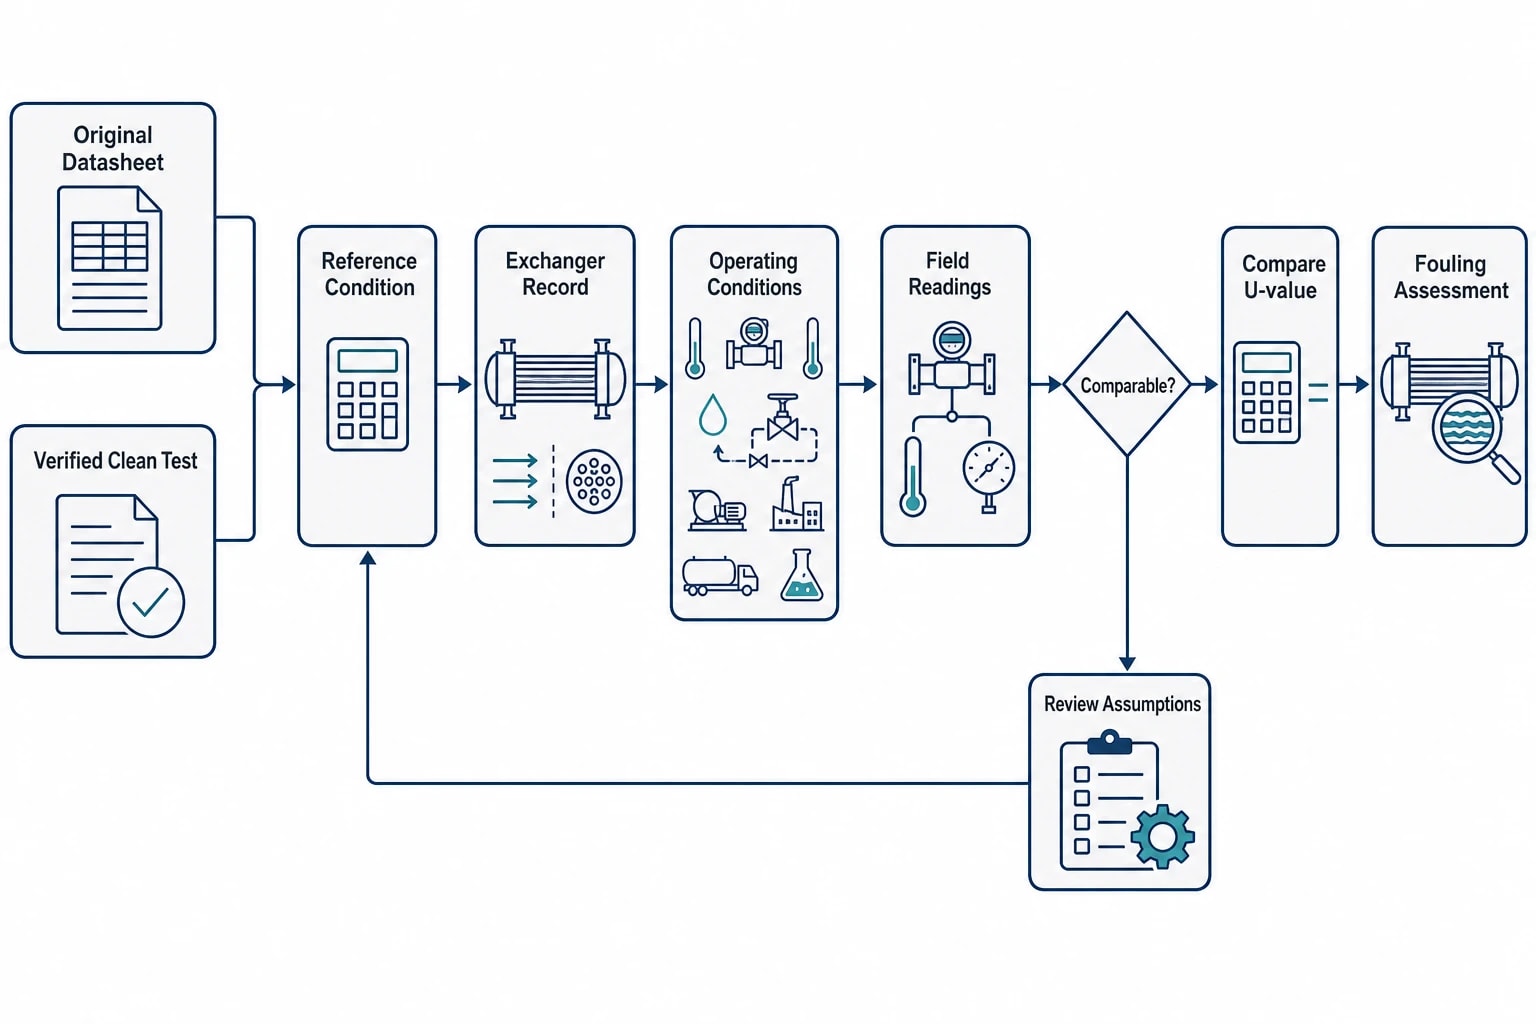
A performance test becomes useful when the reference condition is defined before field readings begin. The reference can be the original datasheet, a commissioning result, a previous verified clean test or a calculated operating target accepted by the process and reliability teams.
Record the operating configuration
The test record should identify the exchanger and conditions that materially affect its result. For most industrial exchangers, that includes:
- exchanger tag, service and flow arrangement
- heat-transfer area and available passes
- process and utility flow rates
- inlet and outlet temperatures on both sides
- nozzle-to-nozzle pressure on each side
- fluid concentration, viscosity or density where relevant
- valve positions, pump duty and bypass status
- production rate and product grade
- last cleaning date, cleaning method and inspection findings
This record prevents a familiar failure in performance reviews: comparing a clean, high-flow water test with a later production run involving viscous product at lower throughput.
Choose the right comparison basis
A design U-value is useful only if the present exchanger and service remain comparable with the design case. Tube plugging changes available area. A modified pass arrangement changes velocity and pressure drop. A changed product concentration changes heat capacity and viscosity. A plate pack may have been expanded or reduced during an earlier overhaul.
Where a clean test baseline exists, it is usually the strongest comparator because it captures the installed exchanger and its actual geometry. Where it does not exist, engineers can use the design case but should state the assumptions and limitations.
Treat thermal effectiveness carefully
Plant teams sometimes use “efficiency” to describe an exchanger’s outlet-temperature result. In technical testing, this can obscure the cause of a loss. Thermal effectiveness, duty, U-value and pressure drop describe different aspects of performance.
An exchanger with unchanged effectiveness can still incur higher utility consumption if inlet conditions have shifted. An exchanger with lower duty may be operating correctly at a reduced flow rate. The U-value, calculated with the appropriate area and temperature driving force, is the more direct indicator of thermal degradation.
Identify where your plant is losing energy and quantify the savings potential — our audits map every heat source, sink, and waste stream in your facility.
Conducting a Reliable Field Test
ASME PTC 12.5 applies to steady-state, two-stream, single-phase heat exchangers, including shell-and-tube, plate-and-frame, plate-fin and tube-in-plate-fin exchangers. Condensers, evaporators, direct-contact units and multi-stream exchangers need a method suitable for their service. Applying a single-phase test procedure to phase-change equipment can produce a misleading result.
Plan the test around the decision
The test objective should be specific. It may be to decide whether an exchanger needs cleaning, quantify the benefit of a completed clean, investigate a capacity constraint or establish a baseline for repeated monitoring.
That objective determines the instruments, operating condition and reference data required. A test intended to verify cleaning should use the same process load and measurement locations before and after the intervention where practical. A test intended to investigate a suspected restriction should focus on nozzle-to-nozzle pressure measurement and flow confirmation.
Control measurement uncertainty
ASME PTC 12.5-2000 (R2025) gives expected uncertainty bands of 3% to 10% for U-value and heat-transfer rate, and 3% to 12% for nozzle-to-nozzle pressure loss, based on 95% confidence, for tests performed in accordance with its methods. These are expected ranges, not a universal accuracy claim for any site dataset.
Actual uncertainty depends on the exchanger, operating conditions, instrument calibration, sensor placement, process stability and calculation method. Small temperature differences can make a U-value calculation particularly sensitive to temperature error. Low or unstable flow can have the same effect on heat-duty and pressure-drop results.
Temperature instruments need representative bulk-fluid locations. A sensor beside a recirculation branch, dead leg or poorly mixed outlet can produce a value that does not represent the stream. Flow measurements need a known operating range and suitable installation. Differential-pressure readings should exclude losses in valves, strainers and nearby pipework unless the test scope expressly includes them.
Prove that the exchanger is at steady state
A batch transition, product changeover or utility-pressure swing can create a plausible but weak dataset. Teams should maintain stable conditions long enough to capture normal process variation, then record averaged readings and their spread.
The code calls for at least 15 minutes for each steady-state test run, with a longer minimum for gas-to-gas service, and recommends at least two runs to demonstrate repeatability. This discipline is proportionate for a production-critical exchanger, particularly where the apparent loss is close to the calculated uncertainty.
Separating Fouling From Other Performance Losses
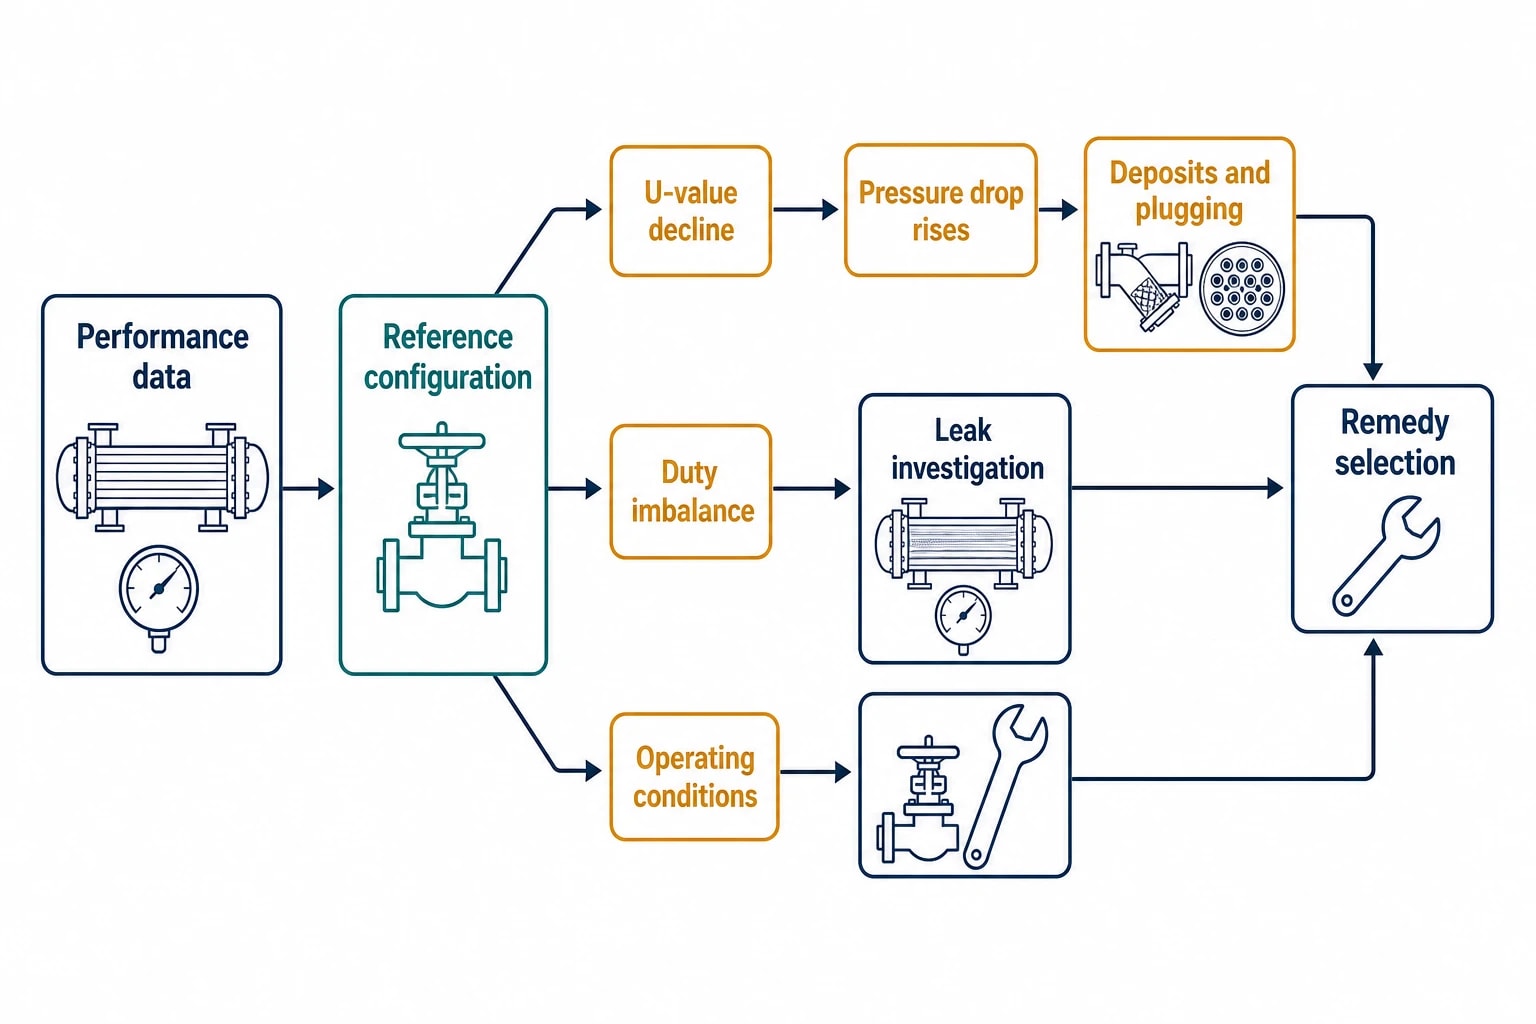
A U-value decline signals that the heat path or operating condition has changed. Inspection and operating evidence identify the cause.
Check the operational causes first
Engineers should confirm that the process matches the reference configuration before opening the exchanger. Common causes of an apparent performance loss include:
- reduced flow caused by pump wear, control-valve position or a blocked strainer
- changed product concentration, viscosity or temperature
- an open bypass or incorrect pass arrangement
- entrained air or gas pockets
- altered utility pressure or supply temperature
- flow maldistribution caused by damaged internals
- reduced heat-transfer area from plugged tubes or isolated plate channels
This work can prevent unnecessary cleaning and avoid returning an exchanger to service with the original problem untouched.
Use inspection to establish mechanical condition
For shell-and-tube exchangers, performance data should guide the inspection scope. A falling U-value paired with rising pressure drop can justify examination for deposits and plugging. A duty imbalance may prompt a leak investigation. Repeated decline after cleaning can point to corrosion, erosion, baffle damage or distribution problems.
TEMA Standards, 11th Edition, issued on 1 July 2024, includes inspection guidance on non-destructive examination techniques and an appendix covering the installation, operation and maintenance of shell-and-tube heat exchangers. The test identifies the asset and symptom. Inspection establishes whether the remedy is cleaning, tube repair, gasket work, internal repair or an operational change.
Turning Test Data Into Maintenance Action
The right intervention depends on the energy penalty, production consequence, mechanical condition, foulant and available outage time.
Quantify the operating penalty
A test result should be translated into its plant consequence. For a heat-recovery exchanger, calculate the additional heating or cooling duty that lost recovery now requires. For a utility heater, quantify the extra steam, thermal oil or electrical load needed to hold the required outlet condition. For a cooler, assess the production-rate or product-temperature constraint created by lost thermal margin.
Site consumption data can support this assessment when aligned with production rate, utility conditions and tested exchanger duty. Whole-site energy data alone cannot prove the cause of a loss. The exchanger test provides the equipment-level evidence needed to attribute the change.
Retest after cleaning or repair
A post-maintenance test is a control point that many sites miss. It confirms whether the intervention restored duty, U-value and pressure drop at the agreed reference condition. It can also reveal incomplete deposit removal, plugged tubes, damaged plates, gasket problems, internal bypassing or an unchanged upstream cause of fouling.
The comparison should retain raw readings, calculation assumptions, instrument details and uncertainty assessment. This creates a usable history rather than a one-off maintenance record.
Build a performance trend
Repeated tests at comparable conditions provide the basis for a cleaning interval that reflects real fouling behaviour. Plot U-value, pressure drop, duty, production rate and cleaning dates together. The trend can show whether deterioration is gradual, whether a process change accelerated fouling and whether previous cleaning restored the expected baseline.
This evidence allows reliability engineers to schedule intervention before the exchanger consumes its remaining thermal margin. Energy managers gain a quantified view of utility loss, while operations teams gain a clearer route to protect throughput and product temperature.
This article reflects the independent analysis and editorial opinion of EnerTherm Engineering. Product names, trademarks, and brands mentioned belong to their respective owners. EnerTherm Engineering is not affiliated with, endorsed by, or a licensee of any third-party software or product mentioned unless explicitly stated.

Technical Manager — EnerTherm Engineering
John Naranjo is Technical Manager at EnerTherm Engineering, bringing specialist expertise in chemical and environmental engineering. He recently led the implementation of Omni Vision, EnerTherm's real-time energy and utility monitoring platform. He holds an MSc in Environmental Engineering from the University of Huelva and a BSc in Chemical Engineering, with memberships in both the Energy Institute and IChemE.
