How a Grand Composite Curve Sets Utility Targets
A shifted-temperature plot that locates the pinch and guides hot and cold utility placement.
A Grand Composite Curve is a shifted-temperature plot of a process’s residual heat surplus and heat deficit. It sets minimum hot and cold utility targets and identifies feasible utility temperature levels.
For a distillation unit, evaporation train or batch pharmaceutical process, the total steam bill offers only a partial answer. A site may reject substantial heat at low temperature while still needing high-pressure steam for a reboiler or reactor feed. The Grand Composite Curve, or GCC, makes that temperature mismatch visible before a heat exchanger network, steam-system change or electrification project is specified.
The GCC is a principal targeting tool in Pinch Analysis. It translates process stream data into a temperature-level view of utility demand. Engineers can target high-pressure, medium-pressure and low-pressure steam, assess cooling-water and refrigeration requirements, and identify internal heat-recovery zones.
What does a Grand Composite Curve show?
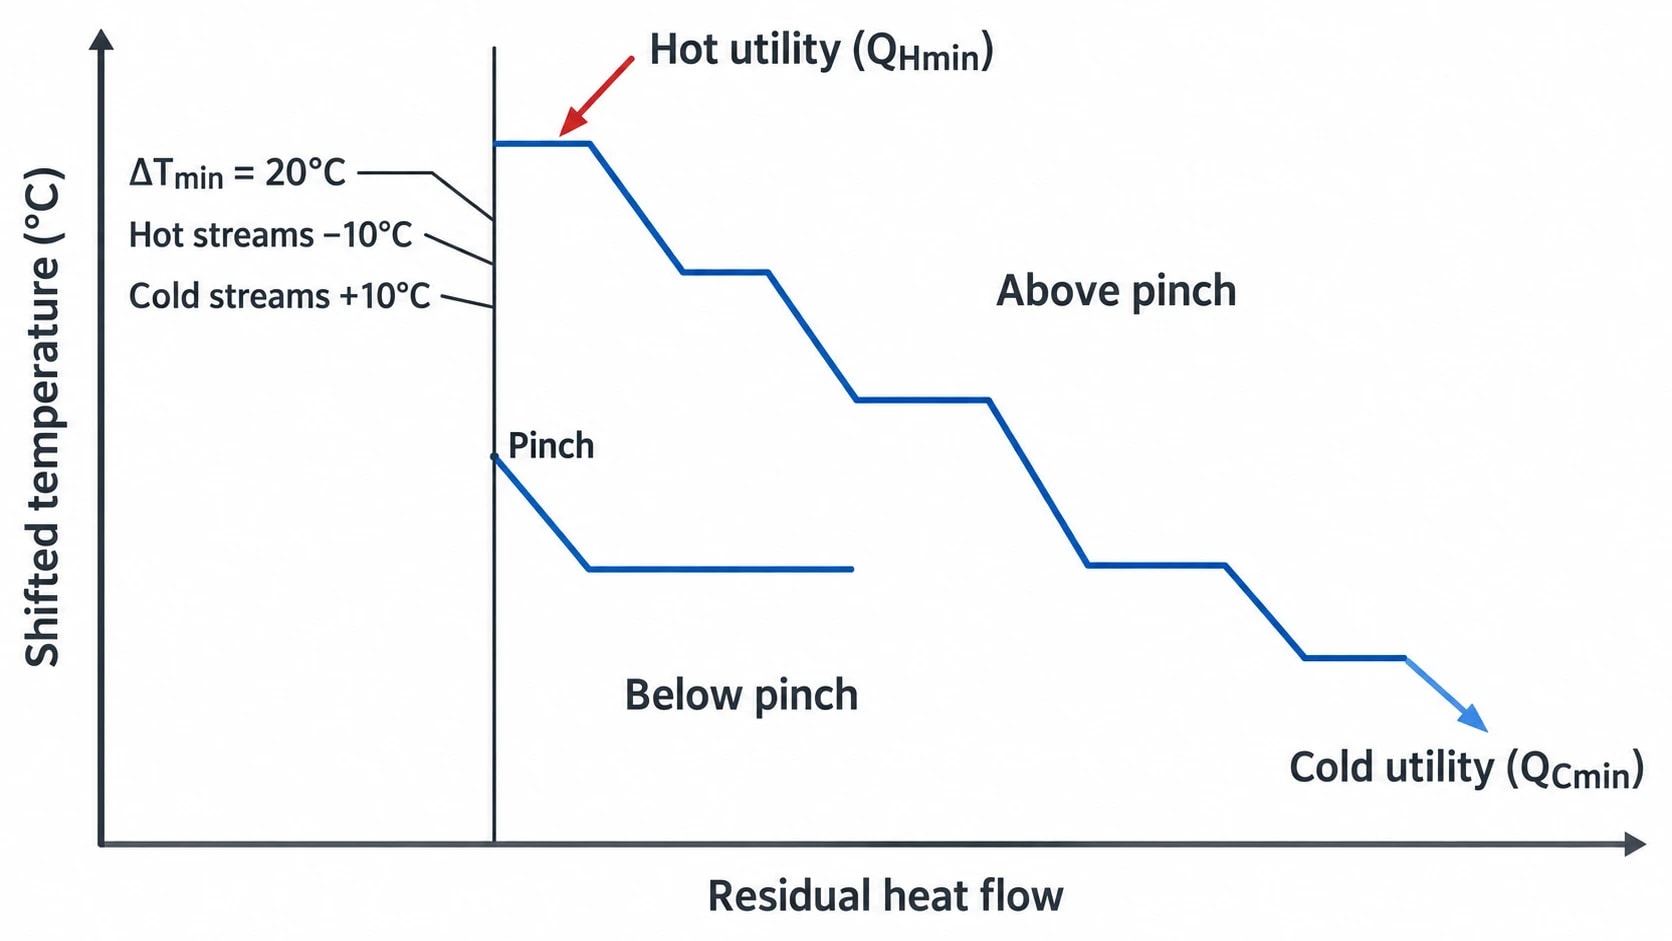
The GCC plots shifted temperature on the vertical axis and residual heat flow on the horizontal axis. It shows the heat remaining after maximum feasible process-to-process heat recovery for the selected minimum temperature approach.
It originates from the problem table algorithm, also called the energy cascade. The cascade adds the net heat released or required by process streams in each shifted-temperature interval. The residual at each interval boundary becomes a point on the GCC.
The pinch point and minimum utility targets
The process pinch is where the GCC reaches zero net heat flow. At this point, the energy cascade has no surplus heat available to transfer across the pinch.
Above the pinch, the process has a net heat deficit and needs hot utility. Below it, the process has a net heat surplus and needs cold utility.
The curve establishes three linked targets:
- Minimum hot utility, QHmin, is the smallest external heating requirement for the defined process data and temperature approach.
- Minimum cold utility, QCmin, is the residual heat that must be rejected.
- Maximum heat recovery is the process-to-process recovery associated with those minimum utility targets.
Composite curves identify overall energy targets. The GCC adds the temperature detail needed to select and place utilities. A plant may have a modest QHmin but still require a high-temperature utility for a small duty at the top of the curve.
Why shifted temperatures matter
Pinch Analysis shifts temperatures to include the required minimum temperature difference, ΔTmin, within the targeting calculation. For a uniform ΔTmin, analysts reduce hot-stream temperatures by half the selected value and increase cold-stream temperatures by the other half.
With a ΔTmin of 20°C, hot streams shift down by 10°C and cold streams shift up by 10°C. The shifted scale compares hot and cold process data while preserving the minimum driving force needed for heat transfer.
Utilities must be assessed on the same basis. Condensing steam is represented at its shifted saturation temperature. A sensible utility, such as hot oil or furnace flue gas, has a profile over its shifted supply and return temperatures. Ignoring the shift can make a utility appear feasible on paper while leaving insufficient temperature approach in the heat exchanger.

Pinch analysis identifies the thermodynamic minimum energy requirement of your process — then designs the heat exchanger network to achieve it.
How is a Grand Composite Curve constructed?
A GCC is only as reliable as its process stream data. Incorrect temperatures, omitted phase changes or an unrepresentative operating case can produce misleading utility targets with impressive graphical precision.
Build a representative stream list
The analyst identifies each hot stream requiring cooling and each cold stream requiring heating. The dataset normally includes supply and target temperatures, heat-capacity flowrate or fixed duty, phase-change duty, operating pressure, fouling allowances and process constraints.
A refinery study may include crude preheat, reactor effluent, column overhead condensation, side-stripper duties and reboilers. A food site may include pasteuriser regeneration, evaporation, cookers and cleaning-in-place circuits. Pharmaceutical studies need to account for campaign timing, batch overlap, product segregation and cleanability.
The operating case needs careful definition. A target based on a short period of stable production may not hold during turn-down, fouling, campaign changes or summer cooling-water conditions. Multi-period Pinch Analysis may be appropriate where stream duties and availability vary materially through the year.
Choose a defensible ΔTmin
ΔTmin is an economic and practical choice, rather than a universal design constant. Reducing it can increase theoretical heat recovery, but usually requires more heat-transfer area and can intensify fouling, pressure drop, control and construction constraints. Increasing it reduces exchanger area but raises the hot and cold utility targets.
The chosen approach should reflect heat exchanger type, fluid properties, allowable pressure drop, fouling tendency, process control and available utility temperatures. Boiling, condensing and viscous duties require particular attention. Where different stream matches need different temperature approaches, the targeting method must apply them consistently.
Run the energy cascade
The problem table arranges all shifted stream temperatures from highest to lowest. Within each interval, it calculates the net heat-capacity flowrate difference between active hot and cold streams and determines whether the interval creates a deficit or surplus.
The first cascade may contain a negative residual. Adding the smallest amount of hot utility needed to eliminate that negative residual establishes QHmin. The final cascade residual gives QCmin.
Plotting residual heat flow against each shifted-temperature boundary produces the GCC. Changes in slope reflect changes in the combined heat-capacity flowrates of active process streams. Inward sections can form heat pockets, which affect utility placement.
How does the GCC target steam and other hot utilities?
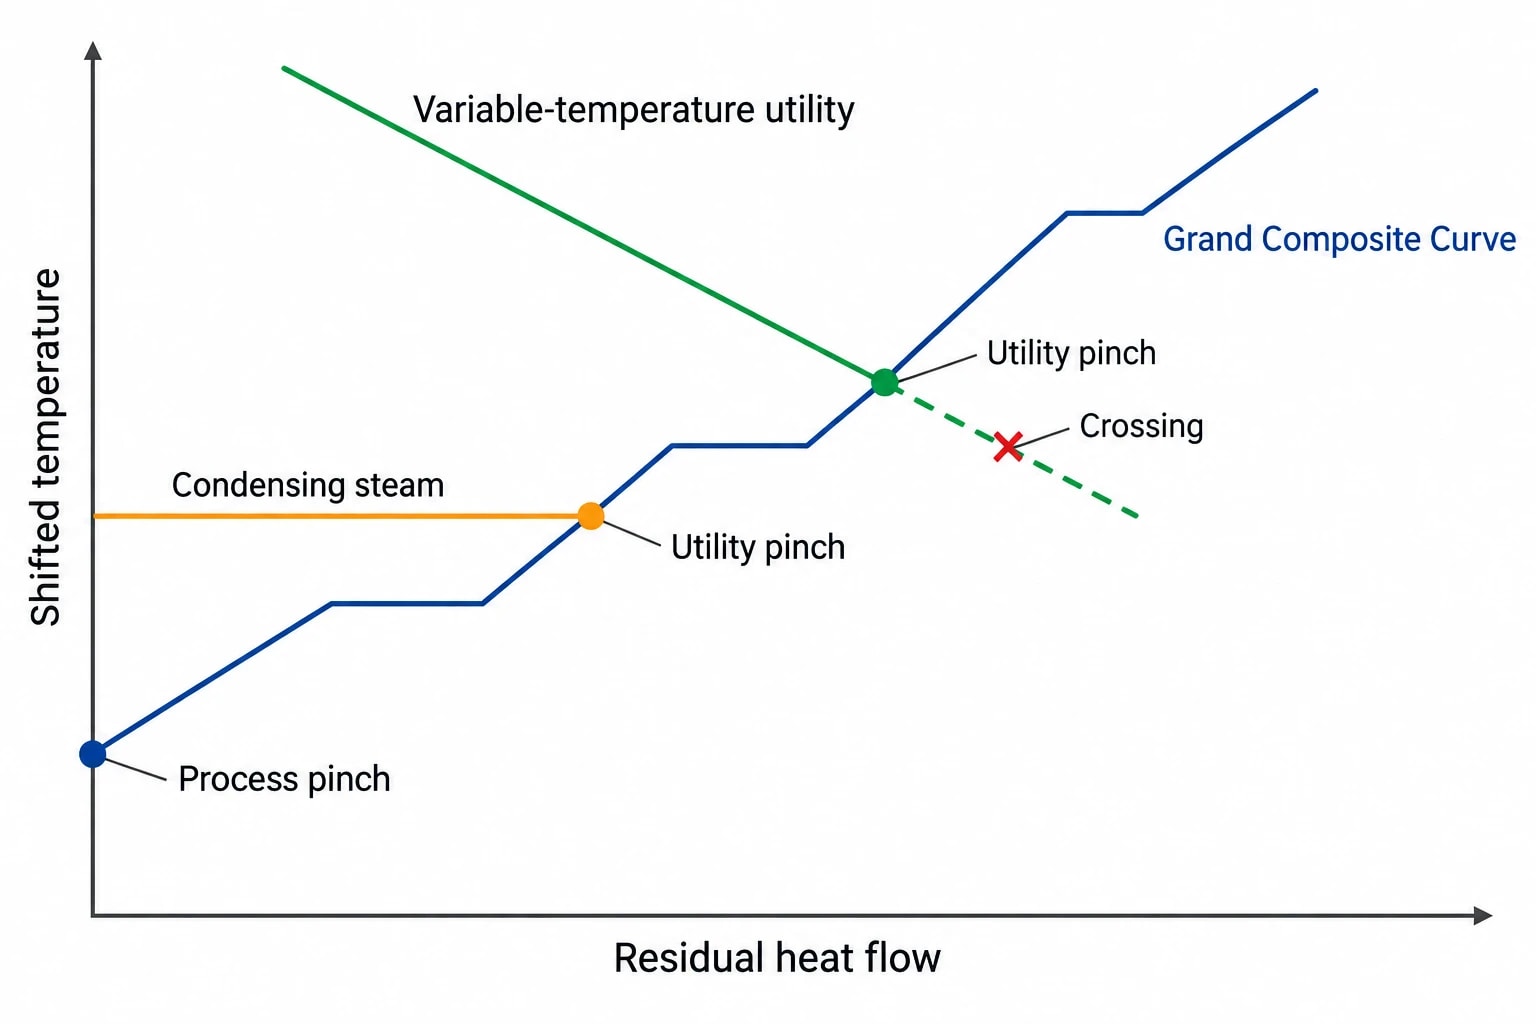
The GCC enables an engineer to match the thermal profile of a utility to the remaining process heat demand. The objective is to supply heat at the lowest feasible temperature level without violating the selected minimum approach.
Place condensing steam at the appropriate level
Condensing steam supplies heat at an almost constant temperature. High-pressure steam can meet high-temperature duties, while medium-pressure and low-pressure steam can serve lower-temperature demands where the temperature approach remains feasible.
An analyst places a steam line against the GCC at the relevant shifted saturation temperature. The potential utility load increases until the steam profile reaches a limiting contact with the GCC. That contact is a utility pinch.
A utility pinch differs from the process pinch. The process pinch sets the minimum overall energy target. A utility pinch limits the heat a particular steam level can supply while maintaining temperature feasibility.
This distinction matters when steam headers have different marginal costs. A GCC can show that low-pressure steam can replace part of a medium-pressure load, but cannot meet the upper-temperature deficit. Steam pressure is therefore a process-integration decision, not merely a boiler-house preference.
Assess sensible hot utilities as profiles
Hot oil, furnace flue gas, gas-turbine exhaust and thermal-fluid circuits cool as they deliver heat. Their profiles slope across a temperature range rather than remaining horizontal like condensing steam.
The utility supply temperature, return temperature, heat-capacity flowrate and any minimum stack or return-temperature constraint determine the usable load. The profile must remain thermally feasible against the GCC. A crossing shows that the required driving force has been lost.
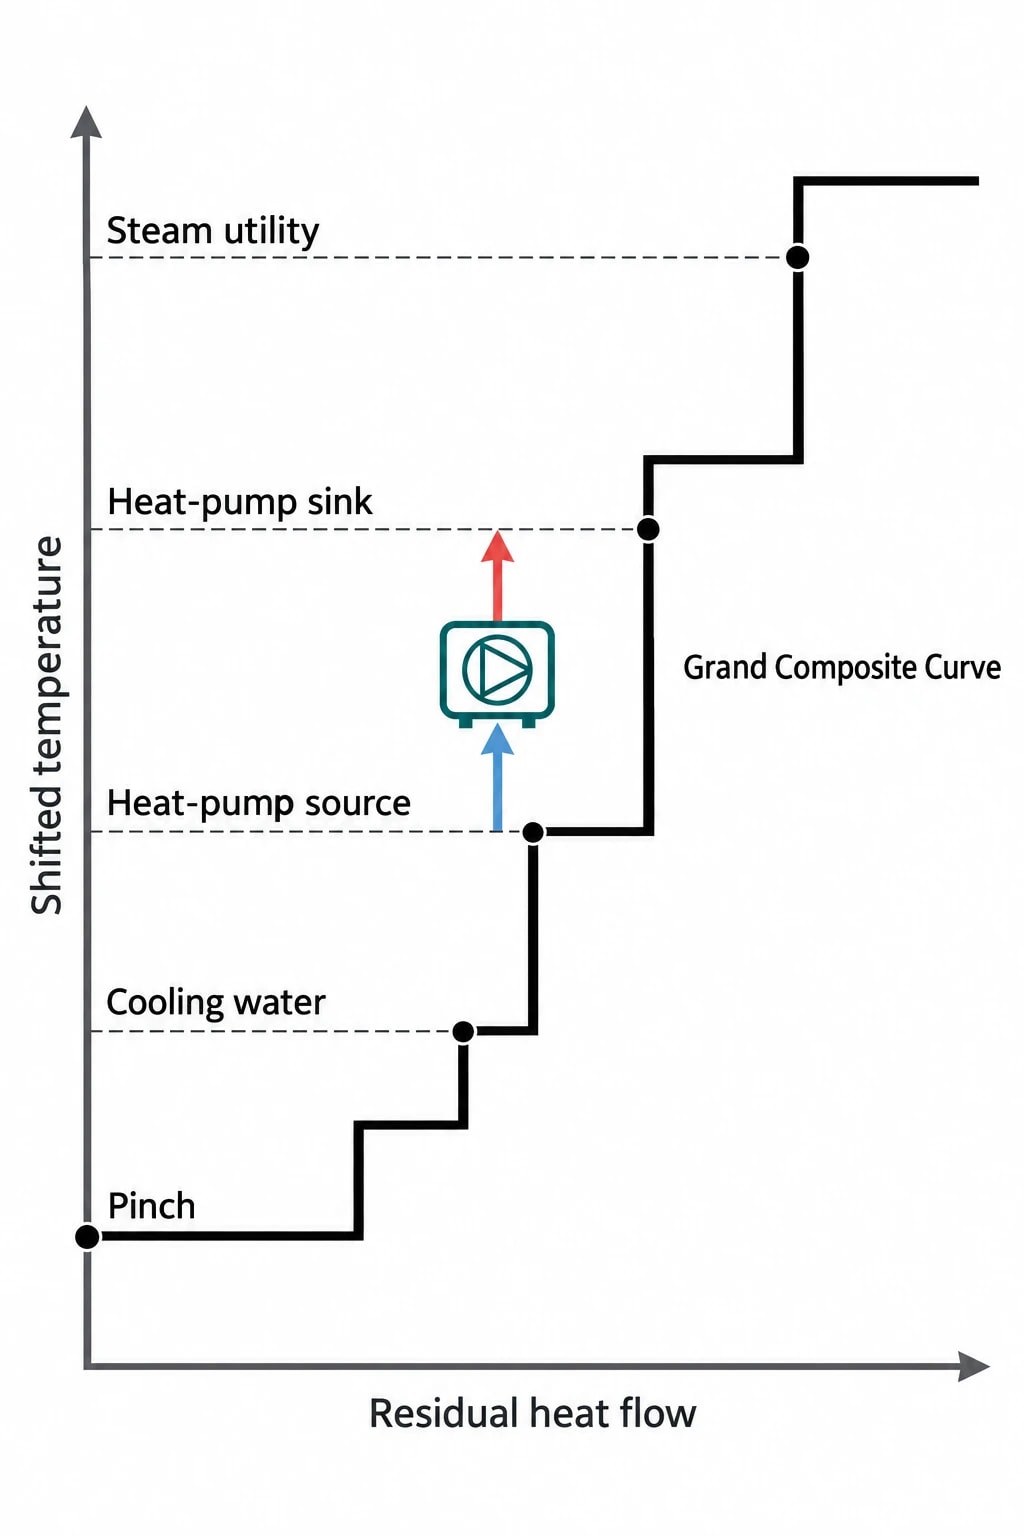
This method can also test the fit of recovered waste heat or an electrically driven heat pump. The GCC identifies the required source and sink temperature levels. Equipment selection still requires checks of heat-transfer area, pressure, contamination risk, control response and operating cost.
Why heat pockets constrain utility placement
A heat pocket is an inward section of the GCC representing a self-sufficient part of the heat cascade. Process streams within that temperature region can meet the relevant heating and cooling demand through internal heat recovery.
Hot utility should not be supplied into a heat pocket. The added heat becomes a surplus that ultimately cascades to cold utility. Steam use and cooling duty rise, while the process heating target remains unchanged.
The 1 MW low-pressure steam case
ScienceDirect Topics reproduces a GCC worked example in Figure 6.3 of its Hot Utility entry, based on the utility-targeting discussion in Pinch Analysis for Energy and Carbon Footprint Reduction. In that example, a heat pocket restricts maximum low-pressure steam to 1 MW.
The process has a larger overall hot-utility requirement, but the low-pressure steam profile cannot extend through the pocket. Medium-pressure steam supplies the remaining duty because it has the temperature needed to serve the higher-temperature process demand.
The case is an operational warning. Spare low-pressure steam-header capacity does not mean a process can absorb more low-pressure steam. The GCC tests the temperature fit before a site changes boiler loading, steam let-down or header allocation.
What heat pockets can reveal
Heat pockets can identify areas for further investigation. Depending on temperature level and operating conditions, engineers may assess:
- Process-to-process heat exchanger additions or modifications
- Boiler feedwater preheating
- Steam generation below the pinch
- Heat-pump integration between a suitable source and sink
- Distillation, evaporation or vapour-compression integration
The GCC indicates thermal opportunity. It does not size equipment, establish material compatibility, confirm steam quality or prove a capital case. Those decisions require detailed process, mechanical, control, safety and economic work.

Pinch analysis identifies the thermodynamic minimum energy requirement of your process — then designs the heat exchanger network to achieve it.
How does the GCC set cold utility targets?
Cold utility placement follows the same temperature-matching principle. Cooling water is appropriate only where its supply temperature and practical heat exchanger approach can meet the process cooling duty.
Match cooling water and refrigeration correctly
Cooling water commonly serves warmer process cooling duties below the pinch. Its achievable temperature depends on site conditions, cooling-tower performance, fouling and seasonal wet-bulb temperature.
Chilled water and refrigeration serve lower-temperature cooling duties than cooling water. A low process target temperature, or a narrow approach to cooling water, may require chilled water, glycol or refrigeration. The GCC identifies the quantity and shifted temperature level of that demand before equipment is selected.
A target based on winter cooling-water conditions can overstate annual heat recovery at a UK site. The study should state the cooling-water supply and return temperatures, seasonal basis and approach assumptions used for utility targeting.
Separate target from retrofit design
The GCC gives a thermodynamic target for the defined process data and ΔTmin. A retrofit still has to fit an operating plant.
Existing heat exchanger area, plot space, tie-in locations, pressure drop, cleaning access, bypass arrangements, batch scheduling, control interactions and outage windows can constrain the final project. Engineers should record the gap between the GCC target and the selected design target, with the reason for each adjustment.
| GCC observation | Utility implication | Required follow-up |
|---|---|---|
| High-temperature deficit above the pinch | Higher-temperature steam, hot oil or fired heat may be required | Check supply temperature and heat exchanger approach |
| Lower-temperature deficit above the pinch | Medium-pressure or low-pressure steam may serve part of the duty | Find the utility pinch and maximum feasible load |
| Heat pocket in the heating region | External heating creates surplus heat | Assess internal recovery or an integrated utility option |
| High-grade surplus below the pinch | Feedwater heating or steam generation may be feasible | Check steam pressure, water quality, control and minimum load |
| Warm cooling requirement below the pinch | Cooling water may be suitable | Test summer conditions and cooling-tower capacity |
| Low-temperature cooling requirement | Chilled water or refrigeration may be required | Assess temperature lift, electricity use and refrigerant requirements |
Where Grand Composite Curve analysis fits UK energy practice
The Department for Energy Security and Net Zero published Updating evidence on energy efficiency potential for UK industry, reference RAF018/2324, on 24 March 2026. The report updates the evidence base for industrial process energy-efficiency measures and earlier industrial decarbonisation and energy-efficiency roadmaps.
For industrial energy managers, a GCC turns a broad energy-reduction ambition into a temperature-specific utility strategy. That is useful when assessing boiler decarbonisation, waste-heat recovery, heat pumps or changes to a central steam system. An annual energy balance cannot establish whether a replacement heat source reaches the process temperature required at a particular point on the curve.
Environmental permitting and energy efficiency
The Environment Agency states that Part A(1) installations under Schedule 1 of the Environmental Permitting (England and Wales) Regulations 2016 must use energy efficiently to obtain and comply with environmental permits in England.
A documented Pinch Analysis can support an energy-efficiency review by setting out minimum utility targets, stream-data assumptions, selected temperature approaches and the practical constraints that prevent a theoretical target from becoming an implementable project. It should sit alongside best available techniques assessment, operating evidence and site-specific feasibility work.
ESOS Phase 4 assessments
ESOS Phase 4 permits participants to include net-zero considerations voluntarily using PAS 51215-1:2025, Energy and decarbonisation assessment - Part 1: Process, and PAS 51215-2:2025, which addresses the competence of lead assessors and assessment teams.
A GCC can provide evidence for a process energy and decarbonisation assessment because it locates heating and cooling demand on the temperature scale. A heat-pump option should be tested against the source and sink temperatures shown by the curve, not assessed solely by annual energy output.
A Grand Composite Curve is a utility strategy before detailed design
A Grand Composite Curve converts a process heat balance into a temperature-level utility target. It establishes QHmin and QCmin, locates the process pinch, limits individual steam levels at utility pinches and prevents wasteful heating in heat pockets.
Build representative stream data. Select defensible temperature approaches. Construct the energy cascade on a shifted-temperature basis. Match feasible hot and cold utilities to the GCC. Then test the target against heat exchanger design, utility-system operation, maintenance requirements and the decarbonisation plan.
This article reflects the independent analysis and editorial opinion of EnerTherm Engineering. Product names, trademarks, and brands mentioned belong to their respective owners. EnerTherm Engineering is not affiliated with, endorsed by, or a licensee of any third-party software or product mentioned unless explicitly stated.

Simulation Engineer — EnerTherm Engineering
Rajesh Sekar is a Simulation Engineer at EnerTherm Engineering, specialising in computational fluid dynamics (CFD), finite element analysis (FEA), and thermal process simulation. He holds a degree from Cranfield University and brings extensive experience in simulation-based product development from the automotive, aerospace, and energy sectors.
