How Chemical Process Optimisation Cuts Plant Energy Use
A technical explanation of using heat and mass balances to reduce energy intensity
Chemical process optimisation is the disciplined use of heat and mass balances, operating data and thermodynamic models to reduce the external energy required to produce an on-spec chemical product. For UK sites in Climate Change Agreements, this work supports the facility-level target periods introduced from 2026.
Energy rarely has one obvious loss point. It is distributed across reactors, distillation reboilers and condensers, evaporators, dryers, refrigeration, steam systems, thermal-oil circuits, compressed air and effluent treatment. A poor heat balance around one unit can increase steam demand elsewhere, overload cooling infrastructure or hide fouling that later constrains production.
Chemical process optimisation puts these interactions on one numerical basis. It defines where energy enters the plant, how the process transfers it, where it leaves and which losses can be removed without compromising safety, quality or throughput.
Chemical process optimisation starts with a reconciled heat and mass balance
A plant cannot optimise from unreconciled data. The heat and mass balance tests whether the P&IDs, plant instrumentation, laboratory results, production records and utility meters describe the same physical process.
A mass balance tracks raw materials, intermediates, products, by-products, vents, purges, wastewater and inventory movements. An energy balance tracks fuel, imported electricity, steam, thermal oil, chilled utilities, recovered heat, reaction heat and heat losses. Together, they quantify the duty attached to each major operation.
Find the source of utility demand
A higher steam bill may stem from a boiler issue, but it may also result from excessive distillation reflux, feed-composition changes, reactor-temperature drift, non-condensable gases in a condenser, reduced exchanger performance or an altered product specification.
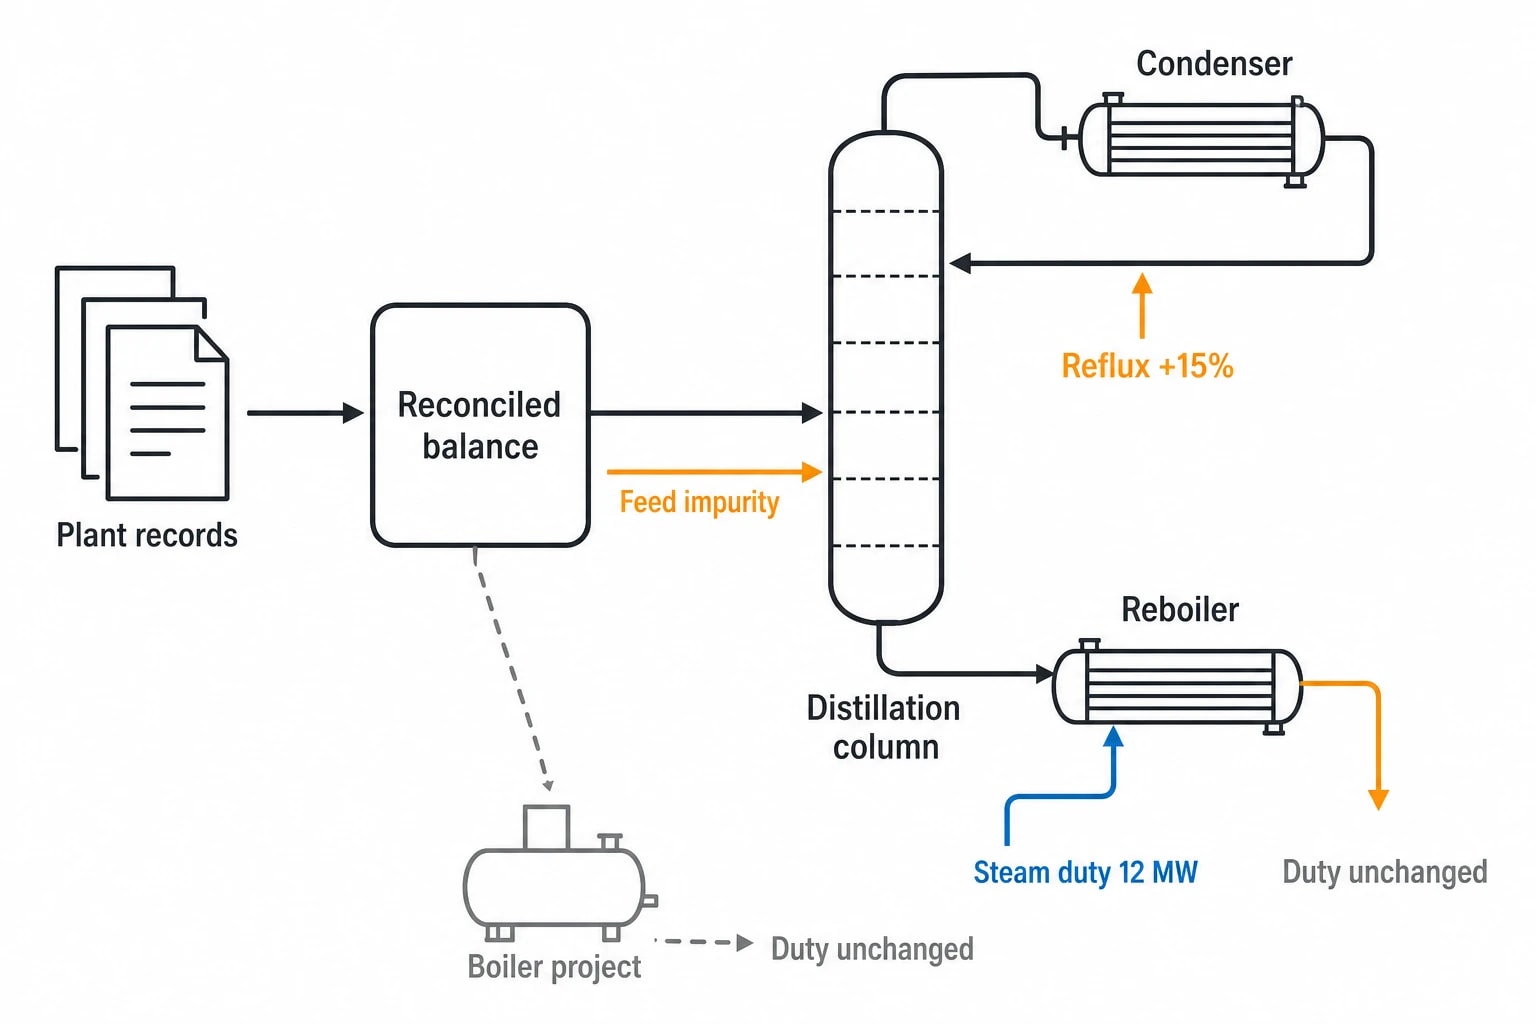
The distinction matters. A boiler project cannot remove a process-side penalty caused by an open bypass around feed preheat.
Consider an illustrative distillation case. A column reboiler consumes 12 MW of steam duty at its normal rate. Reconciled data shows that feed flow has remained steady while reflux has risen by 15% after a change in feed impurity. The optimisation task is to establish whether revised separation targets, feed pretreatment, column hydraulics or heat recovery can lower reboiler demand. Treating the boiler first would leave the underlying duty unchanged.
Build a balance that operations can use
Historical data needs scrutiny before it becomes a model input. Flowmeters drift. Temperature measurements can sit downstream of mixing points. Batch records include start-up, shutdown, cleaning and off-spec periods. Tank movements can distort a monthly material balance.
A useful data package normally includes:
Current P&IDs and process flow diagrams
Fuel, electricity, steam and cooling-water records
Representative operating logs and batch histories
Laboratory assays and product specifications
Equipment datasheets and exchanger inspection records
Control narratives, alarm records and maintenance history
Verified physical-property data and reaction chemistry
The practical output is a current process flow diagram with stream tables, reconciled balances and stated assumptions. It becomes the reference document for process, maintenance, production and finance teams.

Map every energy and material flow in your process with detailed heat and mass balance calculations — the foundation for any optimisation or design project.
Pinch analysis methodology sets the energy target
Pinch analysis methodology identifies the thermodynamic target for heat recovery between streams that need cooling and streams that need heating. It establishes the minimum utility requirement before engineers select specific exchanger matches.
That sequence matters in retrofit work. A chemical plant may contain many heat exchangers while still rejecting useful heat at a temperature that could displace steam elsewhere.
Define streams by duty, temperature and timing
Each hot and cold stream needs a supply temperature, target temperature, flowrate, enthalpy change, phase behaviour and operating schedule. Batch plants require particular care because two streams may have suitable temperatures but never operate at the same time. Condensing vapours, evaporating liquids and reactor heat release also need explicit treatment.
Composite curves combine hot and cold process duties on a temperature and enthalpy basis. Their closest approach identifies the pinch: the temperature region where heat recovery is most constrained.
The analysis should test practical constraints alongside the theoretical target:
Minimum temperature approach required for heat transfer, fouling and control
Allowable pressure drop on process streams
Materials compatibility and contamination risk
Batch timing and campaign schedules
Operating flexibility during grade changes and partial load
Availability of a reliable heat sink for recovered heat
Use temperature approaches as an investment screen
Minimum approach temperature is a cost decision as well as a thermal one. A tighter approach increases heat recovery but requires more exchanger area and can intensify fouling exposure.
An illustrative screening case makes the trade-off clear. A hot process stream can preheat a cold feed by 3 MW with a 20°C minimum approach. Reducing the approach to 10°C may increase recovered duty to 3.6 MW, but the additional 0.6 MW may require substantially more surface area, tighter control and a shorter cleaning interval. The project should compare annual utility savings with installed cost, cleaning cost and lost-production risk.
No single temperature approach suits all chemical duties. Viscous fluids, solids-forming streams, phase change and corrosive service each alter the practical design limit.
Heat exchanger network synthesis turns targets into plant changes
Heat exchanger network synthesis converts a pinch target into an operable network of exchangers, utility connections and controls. Retrofit design differs from clean-sheet design because plot space, existing pipework, metallurgy, maintenance access and outage windows determine what can be installed.
Select measures that preserve availability
A sound study tests several smaller changes alongside major modifications. Options may include process-to-process feed preheat, condenser heat recovery, correction of an existing bypass arrangement, a change in steam-pressure level or restored exchanger performance.
Retrofit questionPotential energy effectEngineering checkCan a hot stream preheat a cold feed?Displaces external heating dutyTemperature approach, contamination risk, pressure dropIs high-pressure steam serving a low-temperature duty?May consume higher-grade heat than requiredSteam hierarchy, control performance, condensate returnIs a condenser rejecting usable heat?Creates simultaneous cooling demand and heating demandHeat-sink availability, seasonal operation, foulingHas exchanger performance fallen?Increases steam, cooling or refrigeration loadTemperature approach, pressure drop, inspection historyDoes a bypass remain open during normal production?Removes installed heat recoveryValve condition, control philosophy, operating practice
An illustrative heat-recovery case shows the scale of the calculation. If a process-to-process exchanger delivers 2 MW of verified duty for 8,000 operating hours a year, it displaces 16 GWh of external heat before allowing for boiler efficiency and site operating conditions. The financial case should use the site’s approved energy price, not a generic tariff.
Treat fouling as a performance variable
Fouling erodes heat-transfer performance and can raise both utility consumption and production risk. It belongs in the energy case.
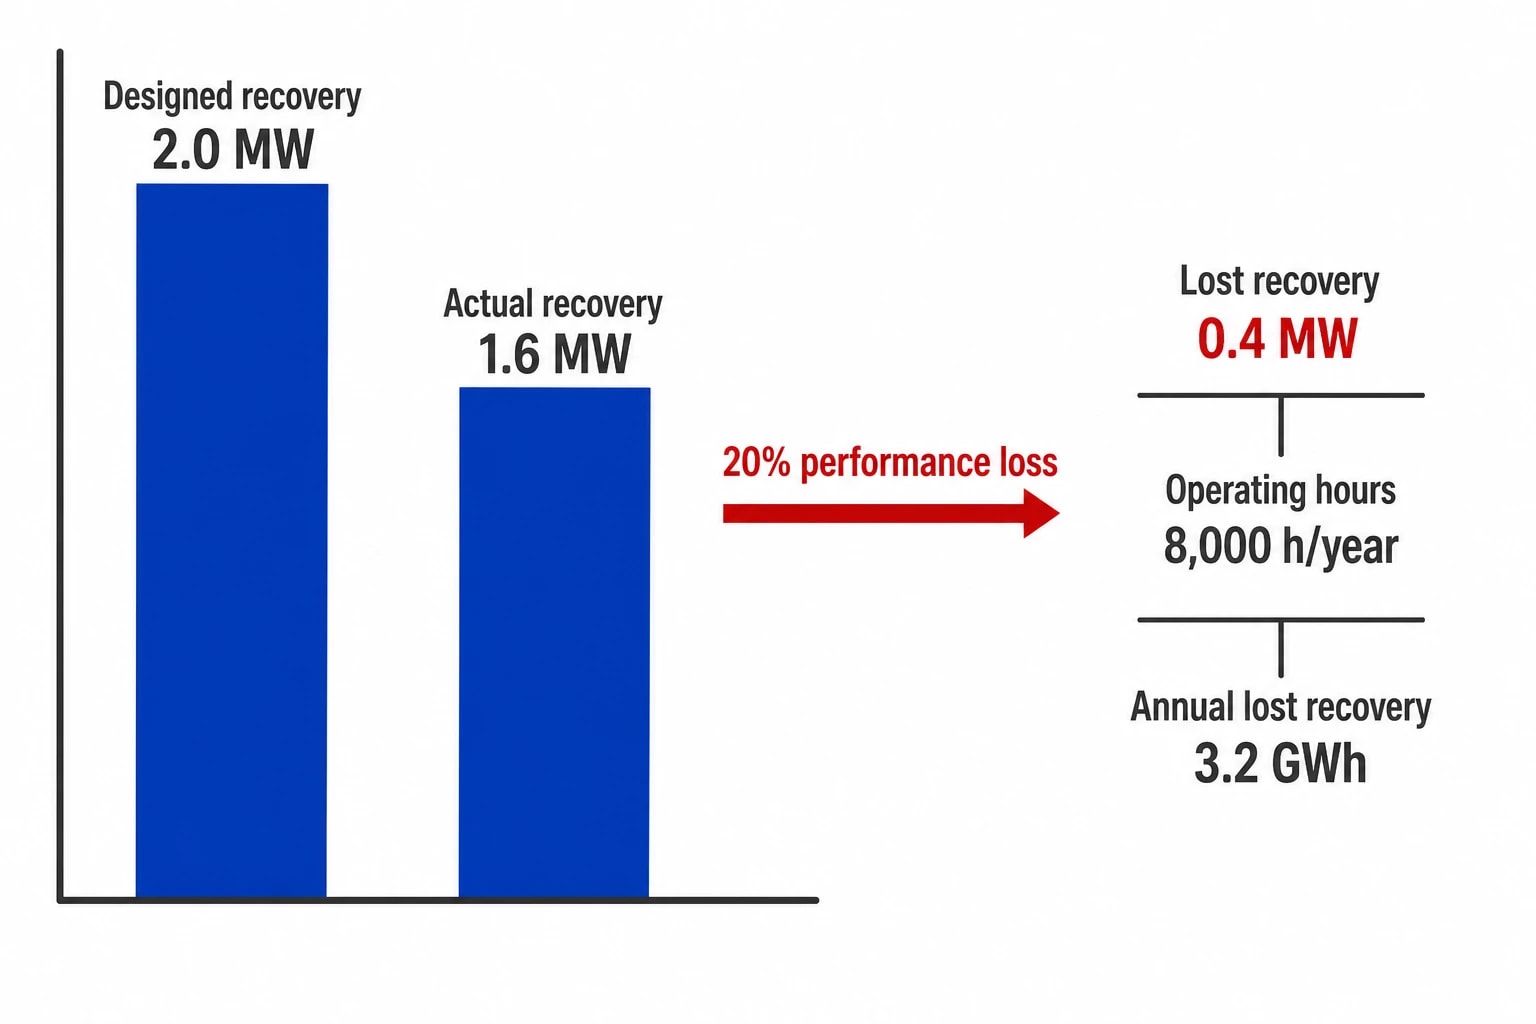
For example, an exchanger designed to recover 2.0 MW may provide only 1.6 MW after a 20% loss in thermal performance. At 8,000 annual operating hours, that 0.4 MW shortfall represents 3.2 GWh of lost recovery. The calculation does not prove that replacement is justified. It establishes the value of inspecting the exchanger, checking temperature measurements, reviewing cleaning intervals and comparing alternatives.
The design must also address controllability. Coupling process streams transfers disturbances between units. Engineers may require utility trim, bypass control, buffer capacity or revised control loops to protect product quality through feed changes and grade transitions.
Process simulation for energy efficiency tests the operating window
Process simulation for energy efficiency extends the reconciled balance into a model that can test changes before plant intervention. Steady-state simulation examines normal operation at a defined rate and composition. Dynamic simulation examines disturbances, start-up, batch sequencing and control response.
Validate physical properties and chemistry
The thermodynamic method must suit the process. Aqueous electrolytes, hydrocarbons, amines, polymer systems, non-ideal liquid mixtures and high-pressure systems require different property models and data checks. Reactive distillation requires both reaction representation and phase-equilibrium validation.
Model validation should compare predicted and measured values across representative operating periods, including:
Process temperatures and pressures
Product, recycle and purge flows
Column top and bottom compositions
Reactor conversion and selectivity
Reboiler, condenser and exchanger duties
Steam flow, condensate return and fuel use
Compressor or refrigeration power
Matching a single steady operating point provides limited confidence. A model should also reproduce credible changes in rate, feed composition and utility conditions.
Debottleneck the plant without moving the energy penalty
Chemical plant debottlenecking often changes utility demand. Raising feed rate can increase reboiler duty, cooling-water flow, refrigeration demand, pump power and compressor load. Better conversion can reduce raw-material losses while increasing reaction heat release or downstream separation duty.
An illustrative throughput study may show that a 10% rate increase pushes a cooling-water system from 80% to 95% of its verified capacity. The process unit may have spare hydraulic capacity, yet summer ambient conditions could restrict production. The preferred project assesses the whole thermal system before equipment is specified.
This is where heat and mass balance, pinch analysis and simulation work together. The balance identifies current duty. Pinch analysis identifies recovery potential. Simulation tests whether the selected change will remain safe and controllable in operation.

Map every energy and material flow in your process with detailed heat and mass balance calculations — the foundation for any optimisation or design project.
Industrial heat recovery systems need a temperature hierarchy
Recovered heat has value only where its temperature, timing and reliability match a real demand. A low-temperature condenser may preheat a feed, heat wash water or support a low-pressure utility. It cannot replace a high-temperature furnace duty.
Match heat quality to demand
Steam systems illustrate the principle. High-pressure steam may serve turbine drives or demanding reboilers. Lower-pressure steam may serve process heating, tracing or deaeration. Condensate provides sensible heat, while flash steam can serve lower-pressure duties.
Industrial heat recovery systems may include:
Process-to-process heat exchangers
Condenser heat recovery for feed preheat
Steam-pressure optimisation and flash-steam recovery
Condensate recovery
Recovery of exothermic reaction heat
Heat pumps for suitable low-temperature duties
Mechanical vapour recompression in evaporation service
Each option has a different utility and maintenance profile. Mechanical vapour recompression, for instance, can reduce thermal steam demand in suitable evaporator duties while increasing electricity demand. The assessment needs the compression ratio, vapour quality, contamination risk, maintenance plan and the site’s energy-cost assumptions.
Energy intensity KPIs verify chemical process optimisation
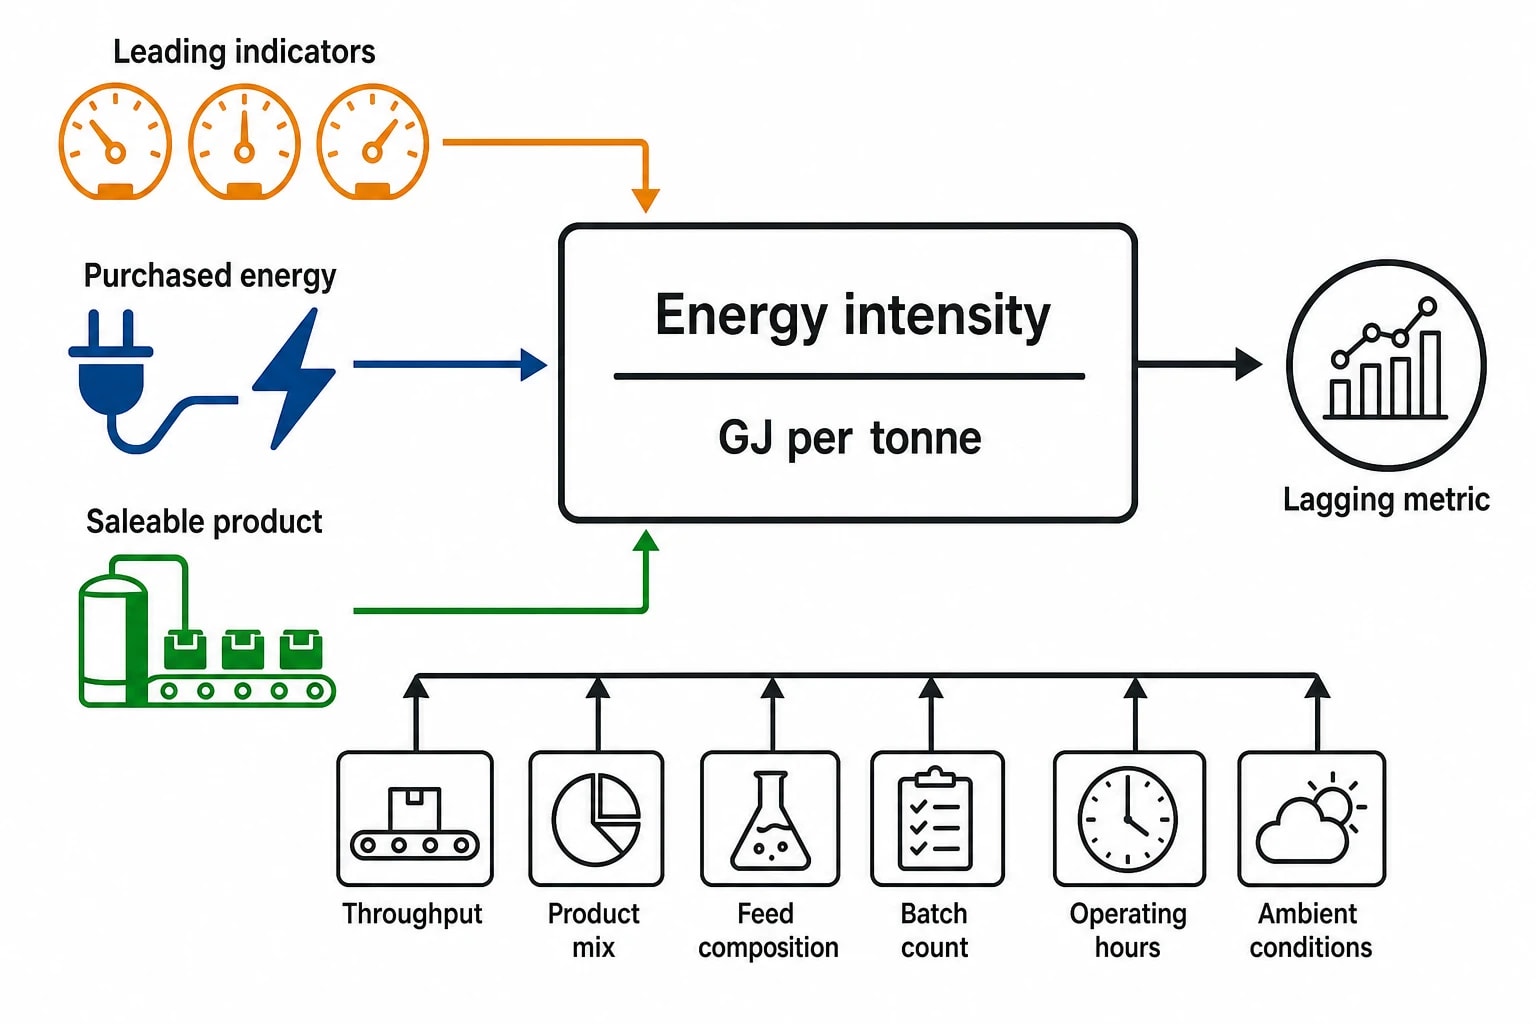
An energy intensity KPI for the chemical industry should connect purchased energy to a meaningful production measure. Common measures include GJ per tonne of saleable product, steam per batch, electricity per tonne of separated product and refrigeration energy per tonne of solvent recovered.
Raw monthly utility totals are insufficient for plants with variable feedstocks, product grades or campaign schedules. The KPI should account for throughput, product mix, feed composition, batch count, operating hours and ambient conditions.
Combine lagging and leading indicators
Energy intensity is a lagging metric. It confirms performance after energy has been consumed. Leading indicators identify the equipment or operating change that produced the result.
Useful indicators include:
Heat-exchanger temperature approach and pressure drop
Steam-to-feed ratio for a defined unit operation
Condensate return rate and condensate quality
Reflux ratio and reboiler steam flow
Compressor specific power
Fired-heater excess oxygen, where applicable
Percentage of normal operation with recovery bypasses open
ISO 50001:2018 provides a structured energy-management framework based on energy performance indicators and baselines. ISO 50002-3:2025 gives process-specific guidance for energy audits using the ISO 50002-1 framework. Applied to a chemical plant, these disciplines make optimisation measurable after commissioning.
UK permitting and CCA requirements shape the investment case
The new CCA target periods are 1 January to 31 December 2026, 1 January 2027 to 31 December 2028, and 1 January 2029 to 31 December 2030. The scheme’s administrative period and associated CCL relief extend to 31 March 2033. The Environment Agency administers the UK CCA scheme, while environmental permitting remains jurisdictional: the Environment Agency in England, the Scottish Environment Protection Agency in Scotland, Natural Resources Wales in Wales and the Northern Ireland Environment Agency in Northern Ireland.
For eligible energy-intensive facilities, a CCA provides reduced Climate Change Levy rates in exchange for meeting agreed energy-efficiency or carbon-reduction obligations. Facility-level targets increase the value of traceable energy data, reconciled baselines and documented changes in production conditions.
Link BAT requirements to the thermal study
Environmental permit applications and permit reviews require operators to address applicable Best Available Techniques. The UK BAT framework retains relevant EU BAT conclusions and has introduced UK BAT conclusions with equivalent legal standing. The European Commission’s Energy Efficiency BREF remains a useful technical reference for whole-site energy management, monitoring, process integration and assessment of improvement options.
A capital proposal should therefore state:
The validated utility baseline and production basis.
The expected energy reduction, including operating hours and measurement boundary.
The impact on throughput, quality, safety and emissions.
Installed cost, outage requirement and maintenance implication.
The post-commissioning verification plan.
An illustrative screen can bring those items together. Using the 16 GWh annual heat-recovery case above, an assumed internal heat cost of £30 per MWh gives £480,000 of annual gross energy value. A £1.2 million installed project would have a simple payback of 2.5 years before maintenance, production and financing effects. The final decision requires the site’s own energy price, availability assumptions and risk assessment.
Chemical process optimisation delivers lasting energy reductions when the plant maintains that verification discipline. Update the balance after process changes, investigate KPI deviations against operating conditions, and keep the heat-recovery network under the same performance review as production equipment.
This article reflects the independent analysis and editorial opinion of EnerTherm Engineering. Product names, trademarks, and brands mentioned belong to their respective owners. EnerTherm Engineering is not affiliated with, endorsed by, or a licensee of any third-party software or product mentioned unless explicitly stated.

Simulation Engineer — EnerTherm Engineering
Rajesh Sekar is a Simulation Engineer at EnerTherm Engineering, specialising in computational fluid dynamics (CFD), finite element analysis (FEA), and thermal process simulation. He holds a degree from Cranfield University and brings extensive experience in simulation-based product development from the automotive, aerospace, and energy sectors.
