How Electrical Load Profiling Finds Peak Demand Waste
A technical explanation of how granular load data exposes factory peak demand waste
Electrical load profiling is the time-based measurement and analysis of a manufacturing site’s electrical demand, energy consumption and power-quality behaviour to identify avoidable peaks, idle loads and production-linked waste.
A monthly electricity bill can confirm total consumption in kWh, but it rarely explains why a factory reached its highest demand. A short overlap between compressed-air generation, refrigeration, electric heating and a production line may create the site’s most expensive demand interval. That event may be brief, yet it can influence charges under a site’s electricity supply arrangement.
Electrical load profiling puts that event into context. It shows when electrical demand rises, which assets contribute, whether the rise coincides with useful output, and which flexible loads can move without affecting safety, quality or throughput. Granular data replaces assumptions with a timed record of plant operation.
What electrical load profiling measures
Demand, energy and load shape
Electrical energy, measured in kWh, records the quantity of electricity consumed over a period. Electrical demand, measured in kW or kVA, records the rate at which the site draws power at a given time. A factory can reduce annual kWh through efficient equipment while retaining high demand peaks if several major loads still operate together.
A load profile plots electrical demand over defined intervals. Half-hourly data can show shift patterns and exposure to supply arrangements based on timed demand. Five- or 15-minute data can reveal repeated sequencing problems. Higher-resolution measurements suit investigations into rapid load changes, plant cycling or power-quality events.
The useful profile is not a single site trend. It connects several layers of evidence:
- Whole-site import at the main incomer
- Demand by distribution board, department or process area
- Major loads such as compressors, chillers, ovens, pumps and production lines
- Production data, including batches, tonnes, machine state, changeovers and downtime
- Relevant power-quality parameters where non-linear loads are present
That combination answers the operational question behind each peak: what was running, and did the factory need it running at that time?
Why coincident demand matters
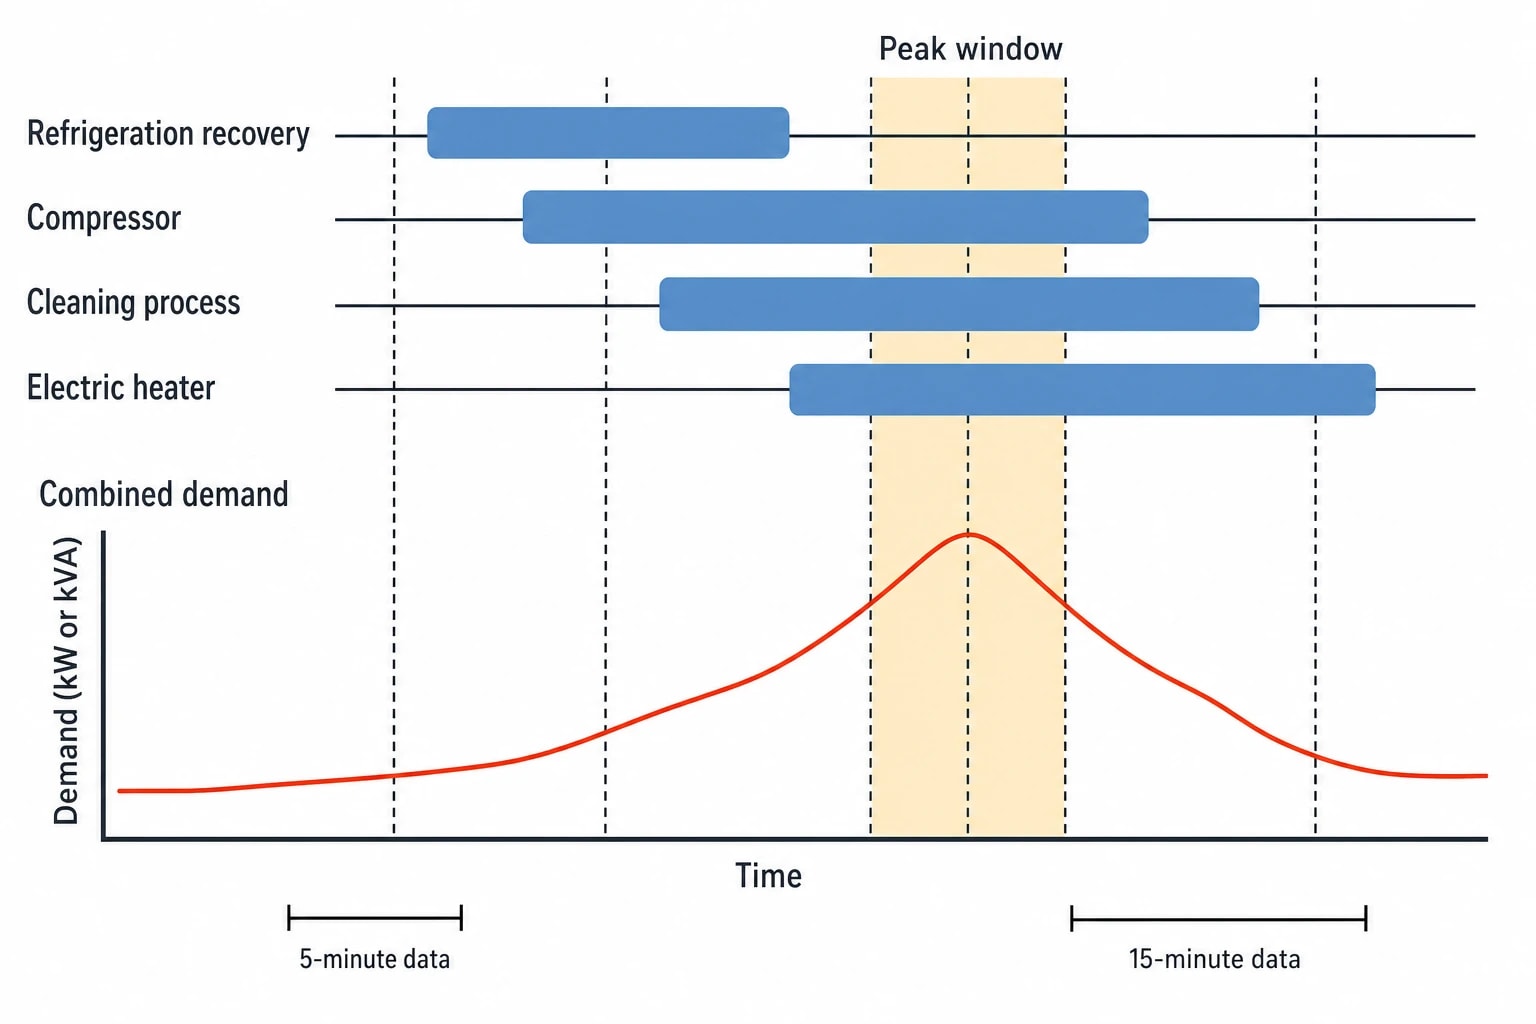
Peak demand frequently results from coincidence rather than one defective asset. Each item of plant may operate within its expected range, but the combined timing creates an unnecessary maximum.
Consider a food factory where a refrigeration system enters a recovery cycle as a compressor loads, a cleaning process starts and an electric heater comes on. Each activity may be legitimate, but their overlap may be avoidable. Load profiling identifies the shared time window, measures the contribution of each metered feeder and gives operations teams evidence for rescheduling.
A high demand interval linked to an essential process may be unavoidable. A similar interval caused by uncontrolled overlap can often be reduced through operating changes with little or no capital expenditure.

Omni Vision delivers turnkey utility metering, CO2 tracking, and AI-powered production KPI intelligence — giving you real-time dashboards and actionable insights across your entire facility.
Where peak demand waste develops in factories
Peak demand waste is electricity drawn above the level justified by production, safety or quality requirements at a particular time. It becomes visible when electrical and production data use the same clock.
Simultaneous start-up after shutdown
Morning start-up is a common source of demand peaks. Operators or time controls may release ventilation, pumps, compressors, charging equipment, HVAC and process machinery within a narrow window. The resulting demand surge can exceed the level required for a smooth return to production.
A profile can show which loads start first, how long they remain at elevated demand and whether a staged start sequence would reduce the maximum interval. This is particularly relevant where equipment has substantial motor loads or electric heating elements.
Batch boundaries and process overlap
Batch production can produce recurring peaks during heating, mixing, transfer, cleaning and sterilisation. A batch trend may appear efficient in total kWh, while its timed demand shows repeated overlap between separate utilities and process loads.
Production-linked profiling distinguishes a high demand interval associated with a planned batch step from one created by waiting time, poor scheduling or an override left in place. The engineer can then focus on a specific event rather than applying a broad reduction target to the entire line.
High base load outside production
A high, flat load during breaks, weekends or planned shutdowns warrants investigation. Likely contributors include compressed-air systems, refrigeration plant, pumps, extraction, uncontrolled heating, charging equipment and auxiliary machinery.
The purpose is not to force all plant off. Refrigeration, safety systems and certain process conditions may require continuous operation. The profiling task is to identify loads without a documented operational requirement and quantify their contribution.
Demand peaks during low output
A peak during low production can indicate a maintenance or controls issue. A compressor may remain heavily loaded because of leakage or an unsuitable control regime. A chiller may draw more power because heat transfer has deteriorated. A heater may remain energised while a process waits for material or operator intervention.
Comparing equivalent shifts, products and batches is essential. A lower kWh figure during reduced output does not demonstrate efficiency. A valid improvement holds product specification, yield and relevant production variables within a comparable range.
Metering design determines what the profile can prove
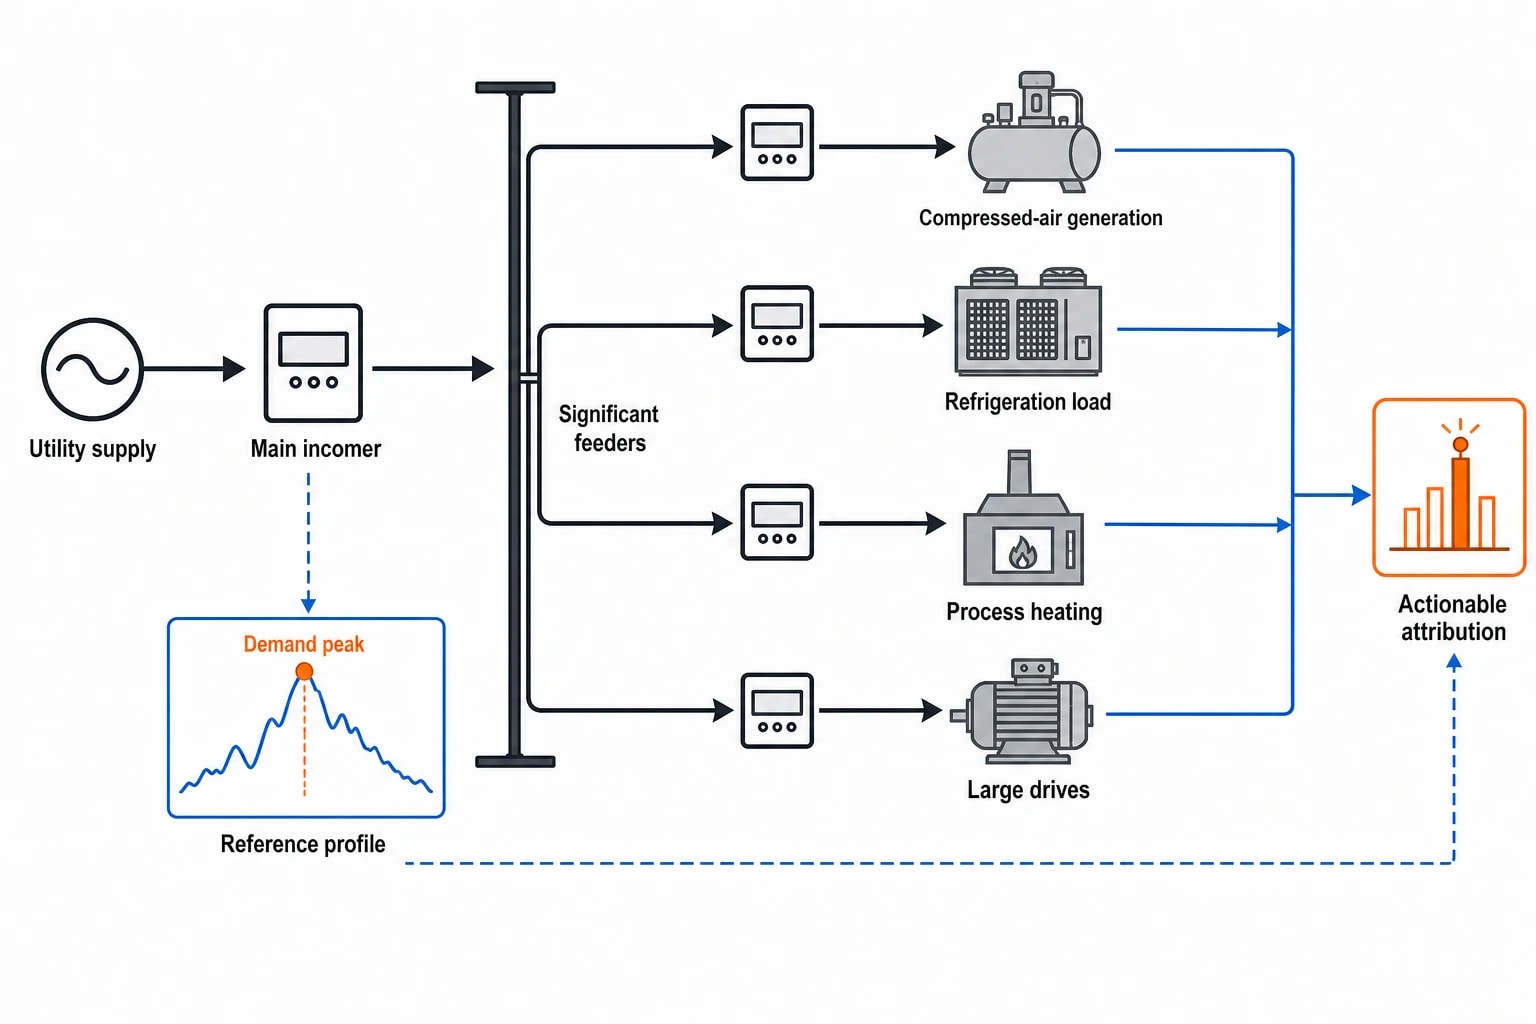
An incomer meter confirms that a peak occurred. Sub-metering identifies the department, feeder or asset that produced it. The difference determines whether a factory can act with confidence.
Map meters to the electrical and production system
Engineers should review the electrical single-line diagram and production flow before selecting metering points. The main incomer normally provides the reference profile. Significant feeders then supply the attribution needed for action.
Priority metering locations commonly include:
- Compressed-air generation and air treatment
- Refrigeration compressors, condensers and defrost loads
- Chillers, cooling towers and large pumps
- Furnaces, ovens and electric process heating
- Injection moulding, extrusion, welding and large drives
- Ventilation and extraction systems
- Battery charging and materials-handling infrastructure
The right metering depth depends on each load’s size, variability and controllability. Metering every final circuit can generate cost and data volumes without improving decisions. Too little sub-metering leaves a peak unexplained.
Select intervals that match the investigation
Half-hourly data remains useful for identifying broad demand patterns and checking utility settlement data. Shorter intervals suit plant sequencing, cyclic equipment and repeated process events. Power-quality work requires instruments configured to capture the electrical parameters relevant to the suspected issue.
Clock alignment is equally important. The meter, production records and maintenance system should share a reliable time source. A five-minute discrepancy can attach a demand peak to the wrong batch, shift or equipment event.
Assess power quality where non-linear loads are material
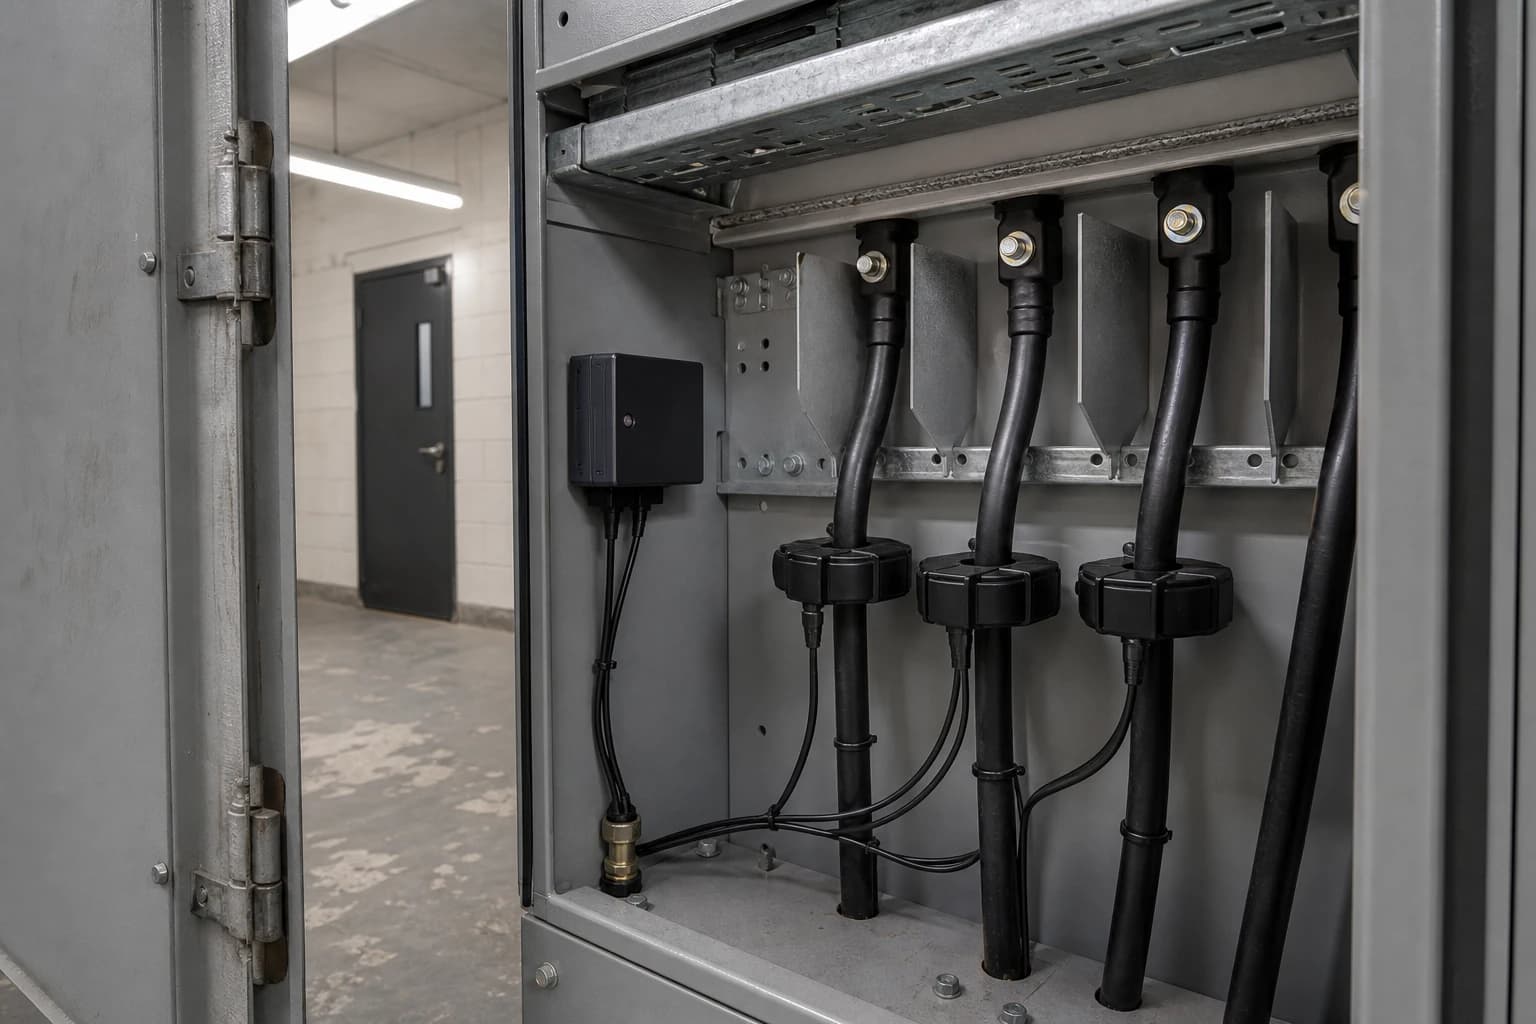
Variable-speed drives, rectifiers, switch-mode power supplies and arc-welding equipment can introduce harmonic currents. Harmonics can increase losses and contribute to thermal stress in conductors, transformers and other electrical equipment. They can also complicate interpretation of current, apparent power and reactive power.
BS EN IEC 61000-4-30:2025 provides methods for in-situ power-quality measurements. The underlying IEC standard covers Class A and Class S measurement methods, including voltage magnitude, flicker, dips, swells, interruptions, unbalance, harmonics, interharmonics and current-related phenomena.
A high kVA value compared with kW may justify further investigation of reactive power or distortion. It does not establish a cause on its own. Engineers need correctly configured measurements, applicable equipment information and a competent assessment of the electrical system.
A practical method for finding peak demand waste
A repeatable process turns a graph into an operating decision.
Establish a representative baseline
Collect data across normal product mix, shifts, planned downtime and seasonal conditions. Record the selected demand interval, peak events, base load and production activity at each event.
ISO 50001:2018 provides a framework for systematic energy management. It uses energy performance indicators and energy baselines to monitor improvement. For manufacturing, total site kWh is seldom enough. More useful indicators may include kWh per tonne, kWh per batch, peak kW per production run and base-load kW outside planned hours.
Rank repeat peak intervals
List the highest demand intervals over a representative period and compare date, time, shift, product and operating state. A single record peak may have an exceptional cause. Repeated events provide stronger evidence for an operational change.
Review whether each interval coincides with planned start-up, defrost, cleaning, compressor loading, simultaneous heating, HVAC operation, a maintenance bypass or low output. The best investigations identify a named physical event and its electrical contribution.
Attribute demand and test a change
Use sub-meter data to identify the contribution of monitored assets within the peak window. Production, maintenance and electrical teams can then determine which loads are essential and which can be shifted.
Controlled trials often provide the fastest answer. Suitable measures include staged starts, revised compressor controls, rescheduled defrost, managed battery charging and altered heating schedules. Operators or building-management systems should apply validated changes during suitable change windows. Record demand before and after the trial, alongside output, quality results, maintenance effects and operator feedback.
A successful measure lowers the chosen demand indicator without creating a safety, quality or throughput penalty. It should then become a documented operating standard, with ongoing review to prevent the original peak returning after a schedule or control change.

Track energy consumption, emissions, and process parameters with seamless PLC/SCADA integration via Modbus, OPC-UA, and MQTT protocols.
Electrical safety and data assurance for load profiling
The Electricity at Work Regulations 1989 apply to electrical equipment used to generate, provide, transmit, transform, rectify, conduct, distribute, control, store, measure or use electrical energy. HSE guidance is directed at dutyholders responsible for achieving electrical safety compliance.
Meter installation and temporary monitoring need suitable planning by competent people. The work should consider isolation, equipment access, panel condition, current-transformer selection, instrument ratings and verification before energisation. Live work requires specific justification and effective precautions.
Data assurance deserves the same discipline as electrical safety. Engineers should check phase assignment, current-transformer polarity, scaling, meter configuration, missing intervals and timestamp consistency. An incorrect CT ratio or reversed current transformer can produce an apparently credible profile that leads the investigation in the wrong direction.
Compare incomer readings with utility data over matching periods. Where practical, reconcile sub-meter totals against the parent feeder, allowing for known unmetered loads and measurement tolerances. A documented check gives production and finance teams confidence that the improvement case rests on reliable evidence.
Electrical load profiling and ESOS Phase 4
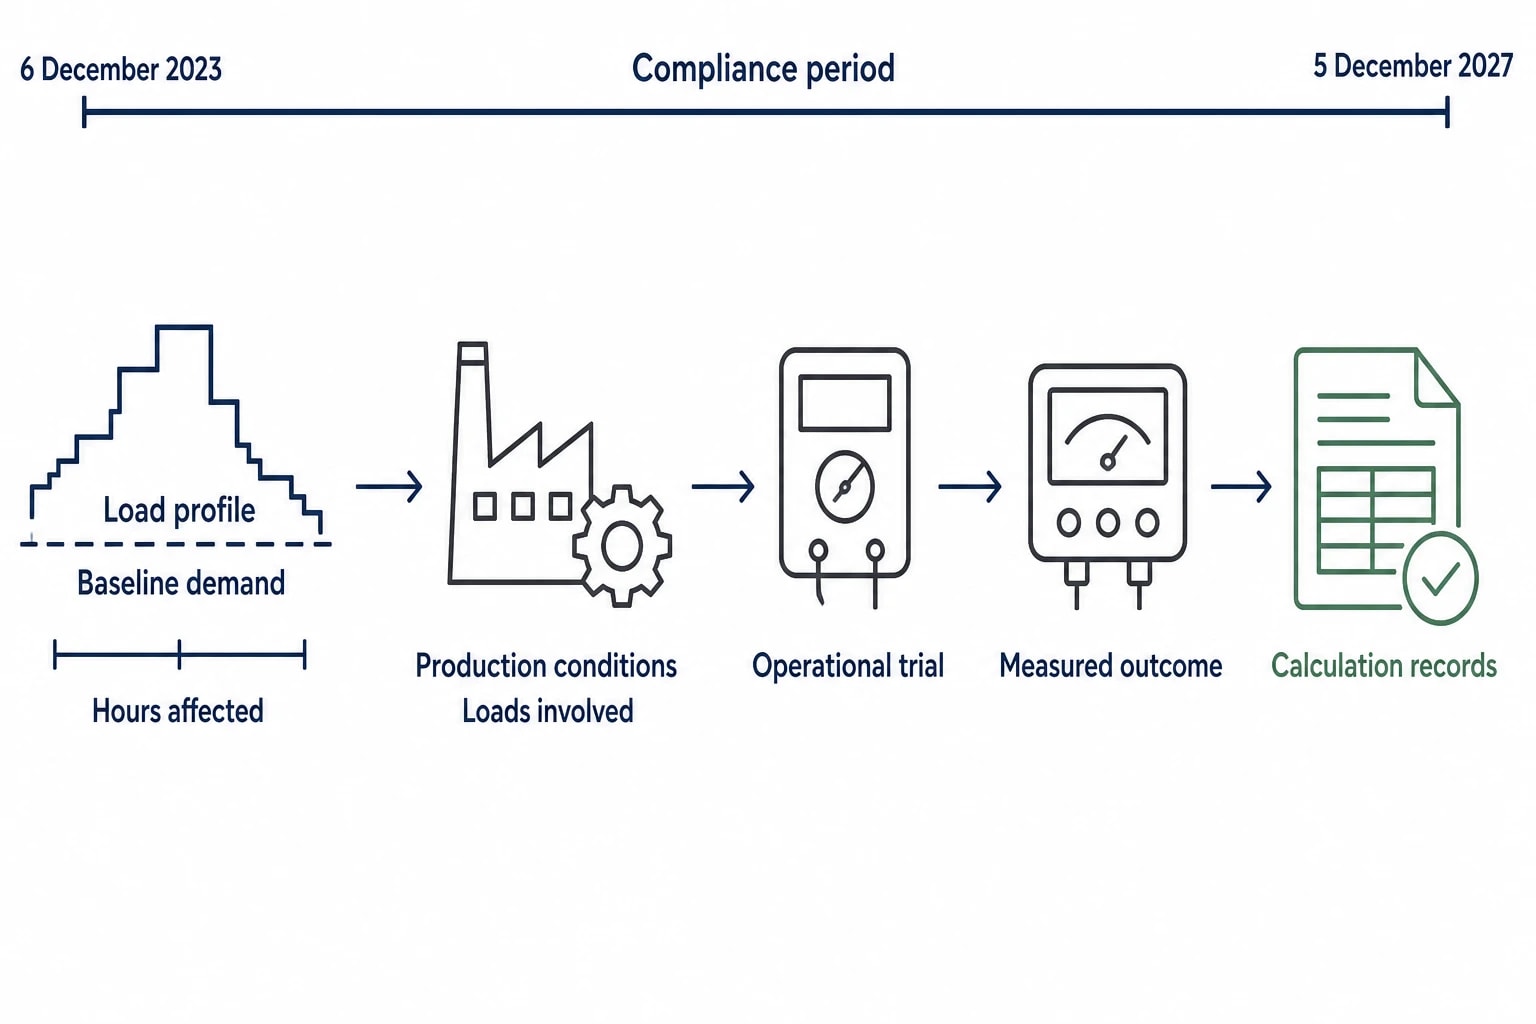
ESOS is a mandatory energy assessment scheme for qualifying large UK undertakings and groups. The Environment Agency administers the scheme. The published Phase 4 compliance date is 5 December 2027, with Phase 4 running from 6 December 2023 to that date.
Government guidance states that ESOS assessments cover energy used by buildings, industrial processes and transport, and are intended to identify tailored, cost-effective energy-saving measures. Phase 4 guidance remains subject to further publication, but the scheme gives manufacturers a reason to develop structured energy and output records now.
Granular electrical load profiling strengthens the evidence behind a recommendation. It can document baseline demand, hours affected, relevant production conditions, loads involved and the measured outcome of an operational trial. That makes a recommendation easier to assess than a site-wide estimate derived from monthly bills alone.
For organisations reporting action-plan progress, measurement records also support the method used to estimate savings. Current guidance requires participants to report the method used for estimates and retain calculation records in the evidence pack. A profile with timestamped production context helps separate a real energy improvement from a fall in output.
Turning peak profiles into plant decisions
Electrical load profiling is most useful when it forms part of routine plant management. Energy managers need clear demand evidence. Operations teams need the same evidence linked to scheduling and output. Electrical engineers need traceable meter configuration and, where necessary, power-quality measurements.
A practical starting point is to investigate the ten highest recurring demand intervals, match each to production activity and quantify the contribution of the largest controllable loads. That exercise can expose idle operation, unsuitable control sequencing and avoidable load overlap.
Omni Vision Energy Intelligence Platform deployments can centralise electrical metering, other utility data and production context for this type of review. The platform identifies events and informs operators and enterprise systems; they validate and implement changes, then retain the result in a measurable baseline.
This article reflects the independent analysis and editorial opinion of EnerTherm Engineering. Product names, trademarks, and brands mentioned belong to their respective owners. EnerTherm Engineering is not affiliated with, endorsed by, or a licensee of any third-party software or product mentioned unless explicitly stated.

Technical Manager — EnerTherm Engineering
John Naranjo is Technical Manager at EnerTherm Engineering, bringing specialist expertise in chemical and environmental engineering. He recently led the implementation of Omni Vision, EnerTherm's real-time energy and utility monitoring platform. He holds an MSc in Environmental Engineering from the University of Huelva and a BSc in Chemical Engineering, with memberships in both the Energy Institute and IChemE.
