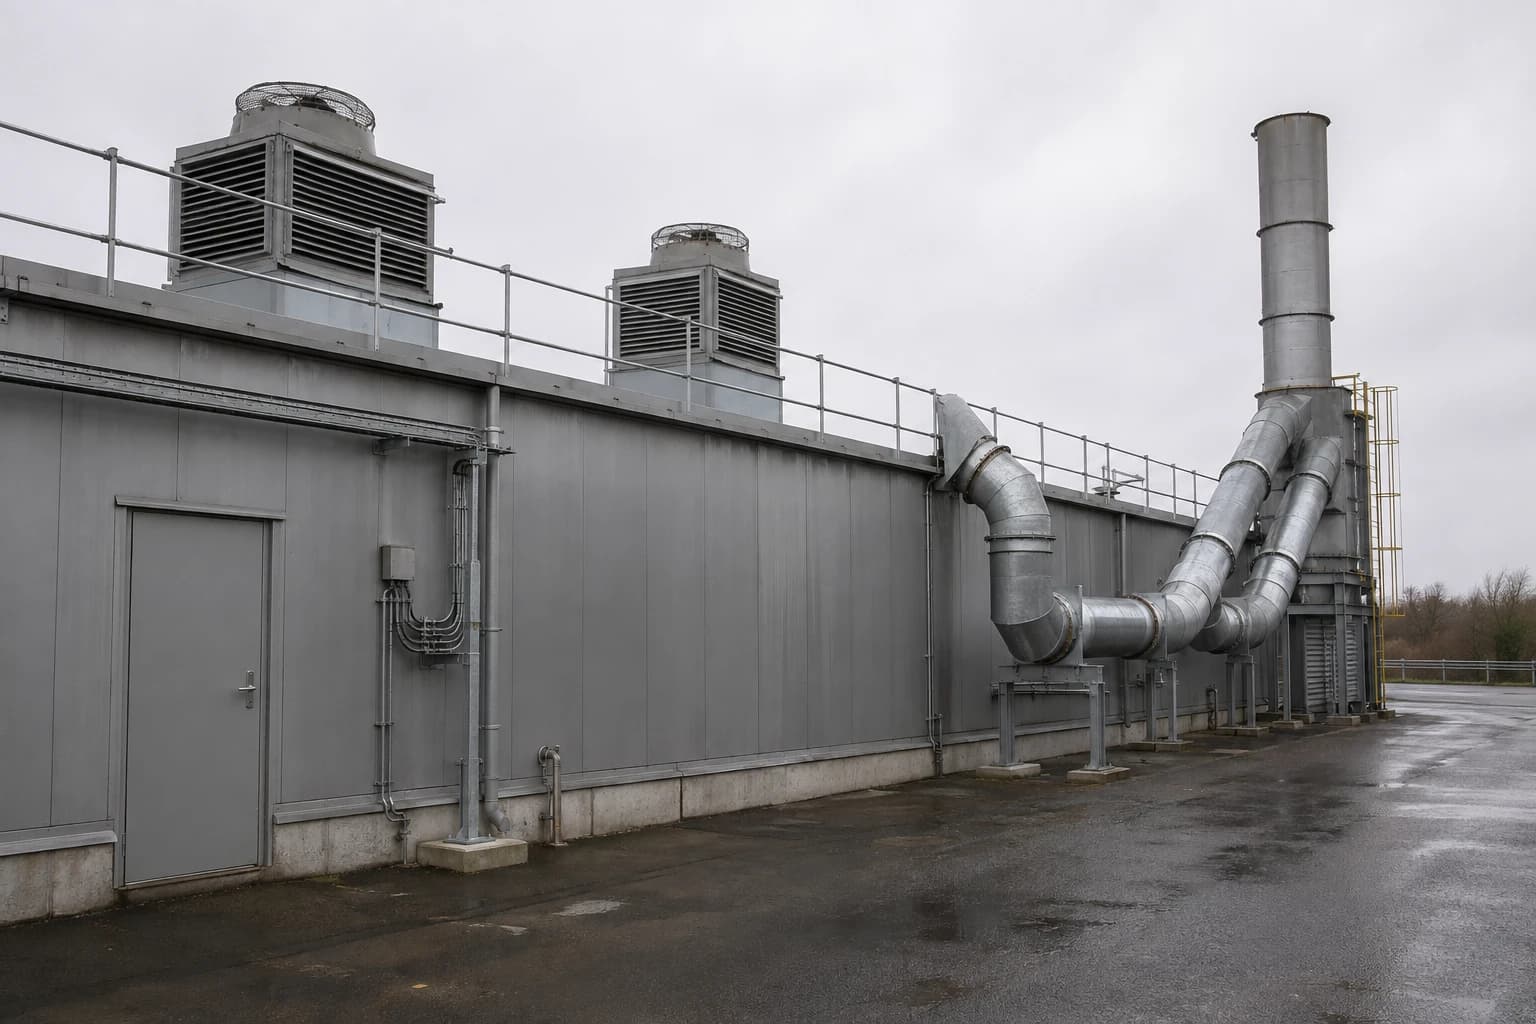
How UK Automotive Plants Cut Scope 1 and 2 Emissions
Average 19% energy cost reduction across paint, HVAC and compressed air loads.
Paint booths consume 30% to 50% of the energy used by a typical automotive assembly plant, according to ENERGY STAR’s automobile assembly benchmark. HVAC accounts for a further 11% to 20%, while compressed air and welding each represent close to one tenth of site energy use.
For UK OEMs and Tier 1 suppliers, this concentration makes Scope 1 and 2 emissions reduction an issue of capital planning as much as sustainability. Strong projects start with measured loads in paint, body-in-white and assembly, then link savings to vehicle output, energy cost, carbon reporting and production risk.
Scope 1 emissions come from fuel combusted in assets the plant owns or controls. In automotive operations, this commonly includes natural gas used by paint-curing ovens, thermal oxidisers, boilers, process heaters and space heating. Scope 2 emissions come from purchased electricity, heat, steam or cooling. Spray-booth fans, air handling units, compressors, robots, welding transformers and conveyors therefore sit at the centre of most Scope 2 reduction plans.
A credible roadmap must reduce kWh and fuel consumption per vehicle before claiming carbon benefit. A green electricity contract can change reported Scope 2 emissions under the chosen reporting method, but it does not reduce the electricity required to cure paint, move air or run a welding line.
Scope 1 and 2 emissions reduction automotive begins with production-normalised data
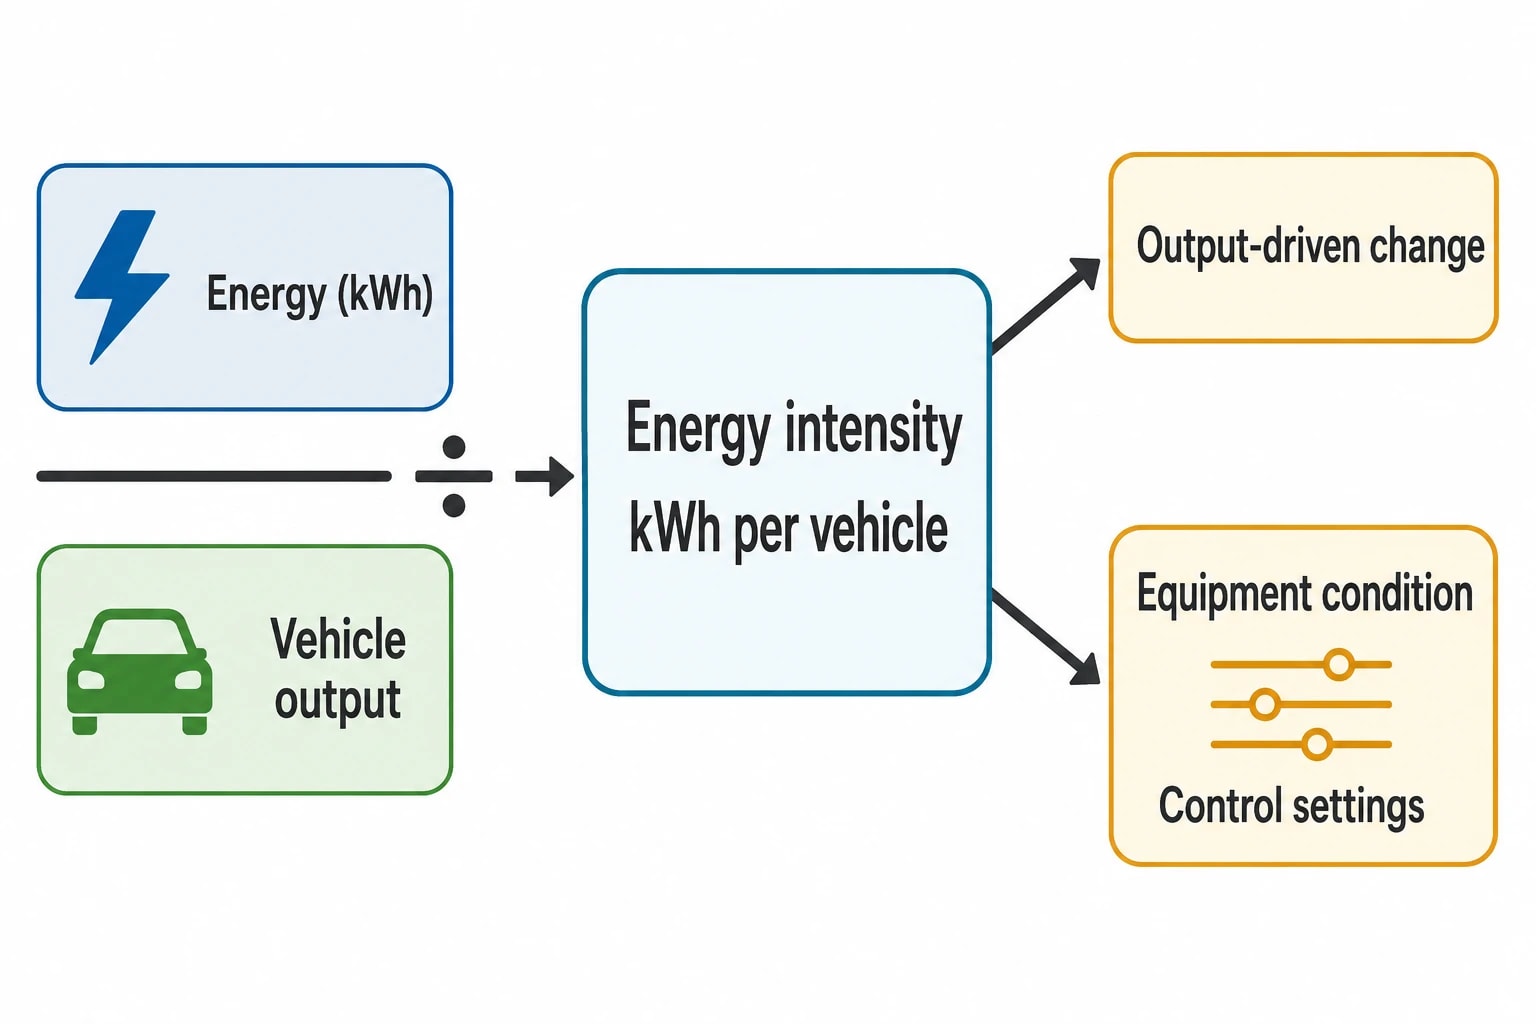
Annual energy spend cannot show whether a plant has become more efficient. Vehicle volume, shift patterns, weather, model mix and planned shutdowns all alter total consumption. A plant may use less energy in a low-output year while consuming more energy for every vehicle made.
Use kWh per vehicle as the core energy indicator
For an automotive assembly operation, kWh per vehicle is a practical indicator of energy intensity. It relates energy to the activity that drives much of the plant’s load and supports comparison between periods with different production volumes.
The most useful reporting structure separates the whole-plant figure from major process areas:
- Body-in-white kWh per vehicle
- Paint-shop kWh per painted body
- Final-assembly kWh per vehicle
- Compressed-air kWh per vehicle
- Natural-gas kWh per painted body or vehicle
- Total Scope 1 and 2 CO₂e per vehicle
This structure prevents a general utility improvement from concealing a deteriorating paint-shop load. It also helps distinguish output-driven changes from those caused by equipment condition or control settings.
ESOS Phase 4 requires participants to calculate energy-intensity ratios for industrial processes. The Environment Agency identifies kWh divided by industrial output as an appropriate ratio for process activity. Cars are among the production units that can be used.
Build a baseline that production and finance can both trust
A baseline should cover at least 12 consecutive months and align meter data with the production record. It needs enough detail to separate controllable energy use from normal variation.
It should include purchased electricity at the incomer and major sub-meters; fuel supplied to ovens, boilers, thermal oxidisers and heaters; production output by model family where relevant; operating hours; shutdowns; and weather information where outside-air conditions materially change paint-shop or HVAC demand.
For compressed air, record pressure, flow, compressor power and running hours. For welding, interval power data should separate active production from standby load. For paint operations, record booth airflow states, oven operating hours, process temperatures and approved changes to air recirculation.
The Department for Energy Security and Net Zero publishes annual greenhouse-gas conversion factors for UK reporting. Plants should document the conversion-factor set, reporting period and organisational boundary used to translate kWh and fuel consumption into CO₂e.
Identify where your plant is losing energy and quantify the savings potential — our audits map every heat source, sink, and waste stream in your facility.
Benchmark the automotive loads that drive emissions and cost
ENERGY STAR’s assembly-plant snapshot is a useful screening benchmark. It is based on North American data and cannot substitute for site measurement at a UK plant. It does, however, show why audit effort should focus on paint, air movement, compressed air and welding.
| Process or utility | Typical share of assembly-plant energy use | Primary audit focus |
|---|---|---|
| Paint booths | 30% to 50% | Supply and extract fans, curing ovens, air recirculation |
| HVAC | 11% to 20% | Operating hours, heating, cooling and fan control |
| Lighting | 15% | Operating hours, controls and task-lighting levels |
| Compressed air | 9% to 14% | Leakage, pressure, inappropriate end use and compressor control |
| Welding | 9% to 10% | Transformer energisation, robot standby and shutdown logic |
| Material handling and tools | 7% to 8% | Conveyor controls, motors and idle running |
| Metal forming | 2% to 9% | Drives, hydraulic systems and thermal loads |
Start with paint-shop energy, but protect process quality
Paint shops combine high electrical demand with large thermal loads. Ovens, thermal oxidisers and heated make-up air can dominate Scope 1 emissions where the plant uses natural gas. Supply and extract fans, pumps, refrigeration and air treatment often dominate Scope 2 emissions.
The key audit question is which loads are necessary to maintain finish quality and compliance, and which remain at a fixed setting when the production state changes.
A booth fan may require defined airflow and pressure balance during painting, but not the same speed in every production state. Quality, production and EHS teams must approve any change, supported by testing for contaminant control, booth balance, drying performance and finish defects.
Examine energy use outside production hours
The most revealing site walk takes place during a planned break, shift change or weekend shutdown. It can identify robots left in standby, energised welding transformers, extraction fans, compressors running against leakage, conveyors operating without product and air handling units maintaining unnecessary schedules.
Monthly utility bills do not expose these loads. Interval metering does.
Power analysers can identify the electrical demand of individual welding cells and robot groups. Ultrasonic leak surveys locate compressed-air losses. Thermal imaging can highlight insulation defects, hot pipework, failed door seals and overheating electrical connections. The aim is to turn a whole-site utility figure into a ranked list of correctable energy uses.
Build a phased Scope 1 and 2 emissions reduction roadmap
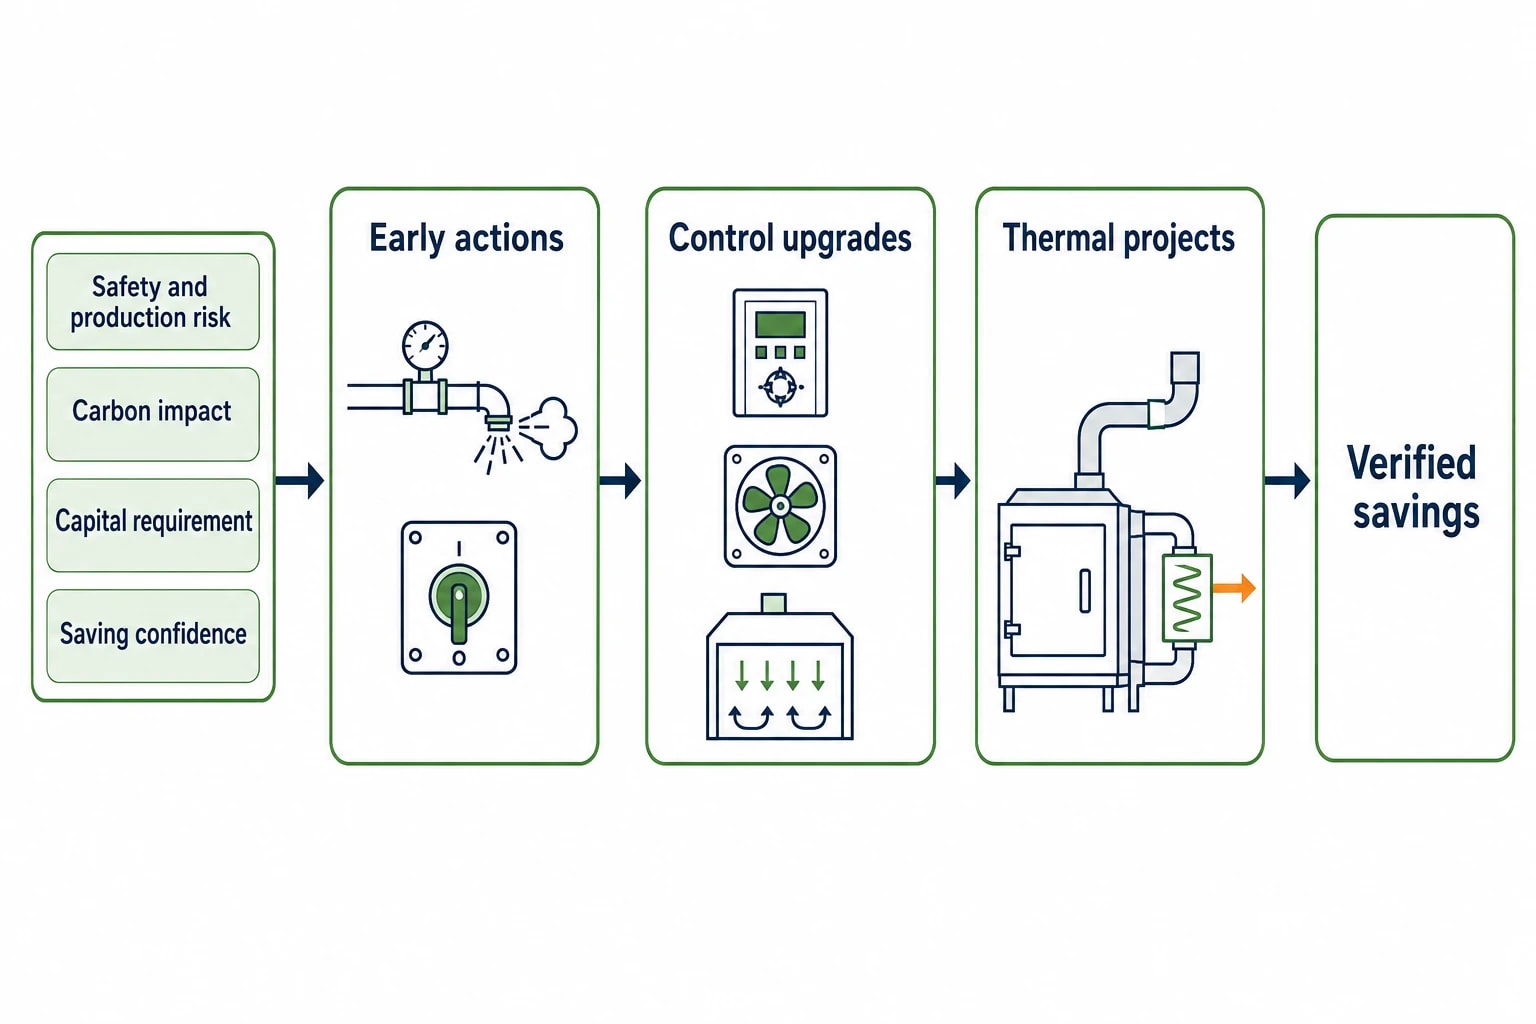
A practical roadmap should sequence work by safety, production risk, carbon impact, capital requirement and confidence in the predicted saving. This lets plants secure early savings while properly developing larger thermal projects.
First 90 days: remove avoidable consumption
Early actions should be measurable, low-disruption and assigned to named owners. Typical measures include:
- Repairing compressed-air leaks and reviewing end uses supplied by compressed air.
- Reducing compressor pressure only after confirming the minimum pressure at the point of use.
- Tightening weekend, holiday and shift-change shutdown procedures.
- Switching welding equipment and robots to approved idle or power-down states.
- Correcting HVAC schedules and fan setpoints within approved operating limits.
- Repairing damaged insulation, failed steam traps and leaking valves where steam systems are present.
- Reviewing oven warm-up and cool-down periods against actual production demand.
A shutdown checklist needs accountable owners from production, maintenance and utilities. Each action should state the expected kWh saving, owner, implementation date, operating constraint and verification method.
Months three to 12: improve controls and utility performance
The next phase usually combines moderate capital spend with tighter control. Compressed-air work may include compressor sequencing, receiver-capacity review, permanent flow metering and variable-speed compressor control where demand fluctuates.
HVAC projects can include variable-speed drives, demand-based control and revised operating schedules. In paint operations, airflow optimisation may provide material Scope 2 savings, but only after process trials establish that revised settings preserve paint quality.
Welding projects should examine transformer loading, robot standby modes, local extraction and automatic shutdown logic. The line must still restart safely and quickly. A control sequence that causes delays or encourages manual bypasses will not retain its saving.
Year one onwards: reduce thermal demand before replacing heat sources
Major Scope 1 projects become more attractive after low-cost waste has been removed. A plant that improves oven insulation, burner tuning, warm-up controls and exhaust management has a clearer view of its future heat requirement.
Potential capital projects include:
- Oven insulation and door-seal upgrades.
- Burner and combustion-control improvements.
- Heat recovery from suitable exhaust streams.
- Replacement of ageing boilers or process heaters.
- Electrification studies for specific thermal loads.
- Process changes that permit lower-temperature operation.
Each proposal needs a defined operating envelope. Oven changes must preserve cure profiles and dwell time. Thermal oxidiser changes must protect emissions-control performance. Heating changes must account for electrical capacity, utility connection times, resilience and the likely production schedule during installation.
Make the cost-benefit case project by project
Simple payback is a useful screening tool, but it should not be the only investment criterion. Automotive capital decisions also require evidence on production impact, maintenance exposure, implementation timing and carbon abatement.
Use a project pipeline rather than a single ranked list
| Project type | Main emissions impact | Capital profile | Evidence needed for approval |
|---|---|---|---|
| Compressed-air leak repair | Scope 2 | Low | Leak survey, compressor trend and repeat test |
| Robot and welding shutdown control | Scope 2 | Low to medium | Interval power data and production-state map |
| HVAC scheduling and fan control | Scope 1 and Scope 2 | Low to medium | Trend data, process acceptance and operating-hour review |
| Paint-booth airflow optimisation | Scope 2, potentially Scope 1 | Medium | Airflow test, quality sign-off and fan-power data |
| Oven heat recovery | Scope 1 | Medium to high | Temperature data, heat-sink match and engineering design |
| Thermal equipment replacement or electrification | Scope 1 and Scope 2 | High | Process trial, load study, grid-capacity review and lifecycle cost |
A short-payback compressed-air measure can help release budget for a more complex oven project. A larger thermal project may still merit approval where it aligns with OEM carbon targets, replacement timing or escalating maintenance risk.
Include costs that sit outside the utility bill
The investment model should account for energy consumption, standing charges, electricity-demand charges where applicable, maintenance, replacement timing, lost-production risk and the residual value of existing assets.
Presenting three cases improves the approval discussion:
- A conservative case using measured or independently validated savings.
- An expected case using likely operating conditions.
- A downside case covering lower output, reduced shifts, delayed implementation or altered model mix.
This prevents a project from relying on future utilisation that may not materialise. It also gives finance teams a clearer view of savings if vehicle volumes change.
EnerTherm Engineering reports average outcomes across industrial audit and optimisation work of 19% energy-cost reduction, a 1.9-year payback period and 1,400 tonnes of CO₂ reduction per year. These portfolio averages are not forecasts for an individual automotive plant. A site-specific business case requires metered evidence, an agreed baseline and an implementation scope reviewed by operations.
Identify where your plant is losing energy and quantify the savings potential — our audits map every heat source, sink, and waste stream in your facility.
Cut Scope 1 emissions from ovens, heating and thermal utilities
Natural gas often represents the largest direct-emissions source in paint operations. The economic order of action is to reduce heat demand first, then assess heat recovery, equipment replacement and electrification against the remaining load.
Reduce unnecessary oven and air-handling heat demand
Audit teams should inspect oven exhaust rates, burner performance, temperature uniformity, insulation condition, door-opening frequency, ductwork losses and warm-up routines. The approved paint system and cure schedule must remain the reference point for every change.
Warm-up and cool-down periods deserve close attention. Heating an oven or air handling unit before an unplanned delay creates Scope 1 emissions and fuel cost without increasing output. A production-linked operating schedule can address this loss without altering the process specification.
Treat heat recovery as an engineering project
Heat recovery works where a sufficiently hot, stable source meets a suitable demand at the right time. An oven exhaust stream may offer useful heat for make-up air or water heating, but the calculation alone does not make the project viable.
The design must address fouling, corrosion, pressure drop, condensate, bypass arrangements, maintenance isolation and control response. It must also define what happens when a heat exchanger is unavailable. Production and paint-quality teams need confidence that a fault will not compromise finish quality or stop the line.
Cut Scope 2 emissions in welding, compressed air and HVAC
Scope 2 reduction depends on making electricity demand follow production. This is particularly relevant where equipment remains energised during idle periods or utilities operate to schedules that no longer match the manufacturing programme.
Meter compressed air as a production utility
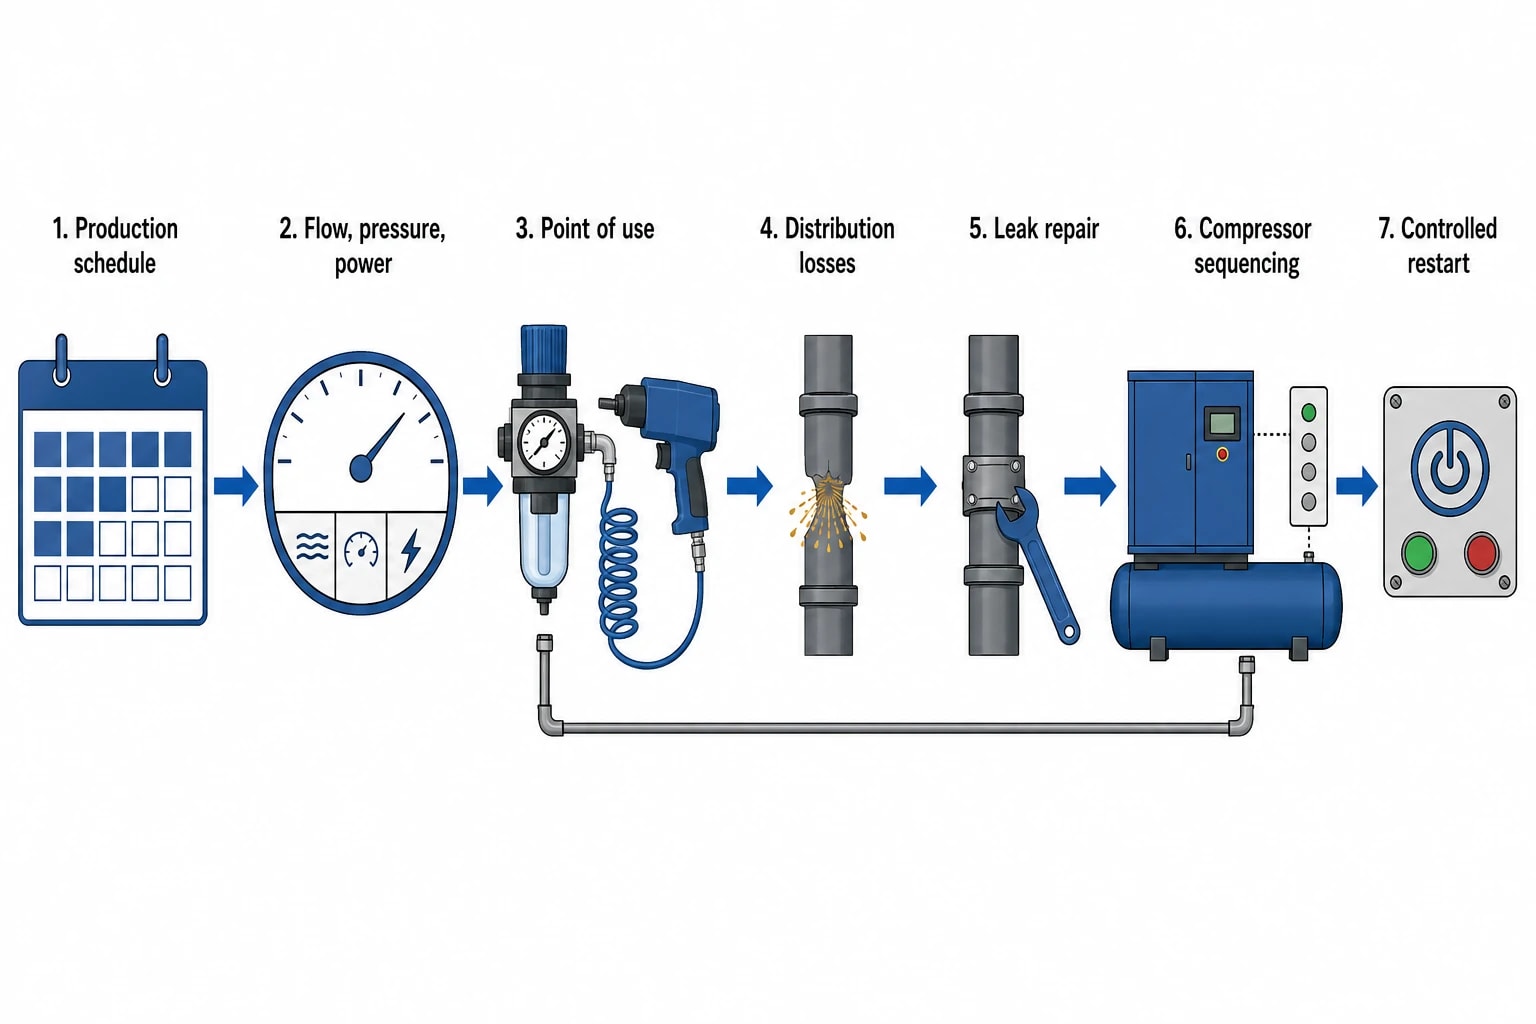
Compressed air converts electrical energy into heat, then loses more energy through leakage, poor control and inappropriate end uses. A proper baseline records flow, pressure and compressor power across production and non-production periods.
Leak repair provides an early opportunity, but it is only one part of the system. Engineers should confirm the pressure required at the point of use, identify pressure losses across distribution, review regulators and pipework, then establish whether compressor sequencing matches demand.
Plants should not lower pressure without this analysis. Inadequate pressure at a critical tool or actuator can transfer cost and risk into production.
Manage welding and robot standby demand
Welding lines combine high instantaneous electrical demand with periods of low productive use. Interval metering can separate active welding energy from transformer energisation, robot standby, extraction and peripheral systems.
Automatic shutdown controls should account for maintenance work, safety circuits, restart times and the production plan. A well-designed sequence removes avoidable idle energy while keeping the line ready for a controlled restart.
Use ESOS Phase 4 to support the capital programme
The Energy Savings Opportunity Scheme Regulations 2014, as amended, provide a useful structure for turning audit findings into an investment programme. The Energy Savings Opportunity Scheme (Amendment) Regulations 2023 introduced requirements including energy-intensity ratios, implementation considerations, cost and benefit estimates, and payback calculations for identified opportunities.
Qualifying large undertakings must notify compliance for ESOS Phase 4 by 5 December 2027. Energy audits should use verifiable energy-consumption data over 12 consecutive months where reasonably practicable. Participants must cover at least 95% of total energy consumption through an appropriate compliance route, and site visits must represent how energy is used across the assessed assets and activities.
Integrate decarbonisation into the audit scope
PAS 51215:2025, Energy and decarbonisation assessment - Process, provides a voluntary route for combining an energy assessment with the identification and evaluation of decarbonisation options. For automotive plants, it can connect ESOS evidence with a practical Scope 1 and 2 roadmap rather than leaving the audit as a compliance document.
ISO 50001:2018 provides a management framework for retaining the work after the audit. It supports an energy review, identification of significant energy uses, objectives and performance checks over time.
Verify savings after implementation
IPMVP Core Concepts 2022 provides a recognised approach for defining the baseline, measurement boundary, adjustment factors and reporting method before a project goes live.
For a paint-booth project, adjustment factors may include painted-body output, paint throughput and outdoor conditions. For compressed air, they may include production hours, pressure and demand profile. For welding, they may include line utilisation and vehicle model mix.
This article reflects the independent analysis and editorial opinion of EnerTherm Engineering. Product names, trademarks, and brands mentioned belong to their respective owners. EnerTherm Engineering is not affiliated with, endorsed by, or a licensee of any third-party software or product mentioned unless explicitly stated.

Managing Director — EnerTherm Engineering
Dr. François Pierrel is Managing Director of EnerTherm Engineering with over two decades of expertise in thermal design, heat transfer, and industrial energy optimisation. He holds a PhD in Heat Transfer from Cranfield University and a Post-Doctorate from Heriot-Watt University.
