Why Paint Shops Lead the Automotive Decarbonisation Roadmap
An ROI case for paint-shop energy cuts, with an average 1.9-year payback.
At Stellantis, paint shops generate around 65% of an assembly plant’s CO₂ emissions, despite representing only one area of vehicle production. That concentration makes paint the first capital-planning question for many automotive energy and sustainability managers.
The automotive plant decarbonisation roadmap has become more demanding. OEM climate mandates now reach manufacturing plants and Tier 1 suppliers through procurement, annual reporting and investment approval. UK sites must reduce Scope 1 and 2 emissions while maintaining finish quality, takt time and model-mix flexibility. Paint shops sit at the centre of that equation because they combine high-temperature curing, large air volumes, continuous ventilation and tightly controlled conditions.
Body-in-white, trim, welding and robotics also offer savings potential. Paint shops, however, can offer the largest single emissions reduction and a strong operational case for phased capital investment. An audit that converts paint-shop consumption into kWh per vehicle, separates fixed from throughput-dependent loads and tests production constraints gives management a credible route from technical opportunity to funded project.
Why paint dominates the automotive plant decarbonisation roadmap
Ovens create the largest thermal load
Automotive paint curing requires controlled temperature, airflow and dwell time. Conventional systems often use gas-fired ovens, making them a significant source of Scope 1 emissions. Their thermal mass, exhaust losses and operating schedules mean energy use can persist through breaks, changeovers and reduced output.
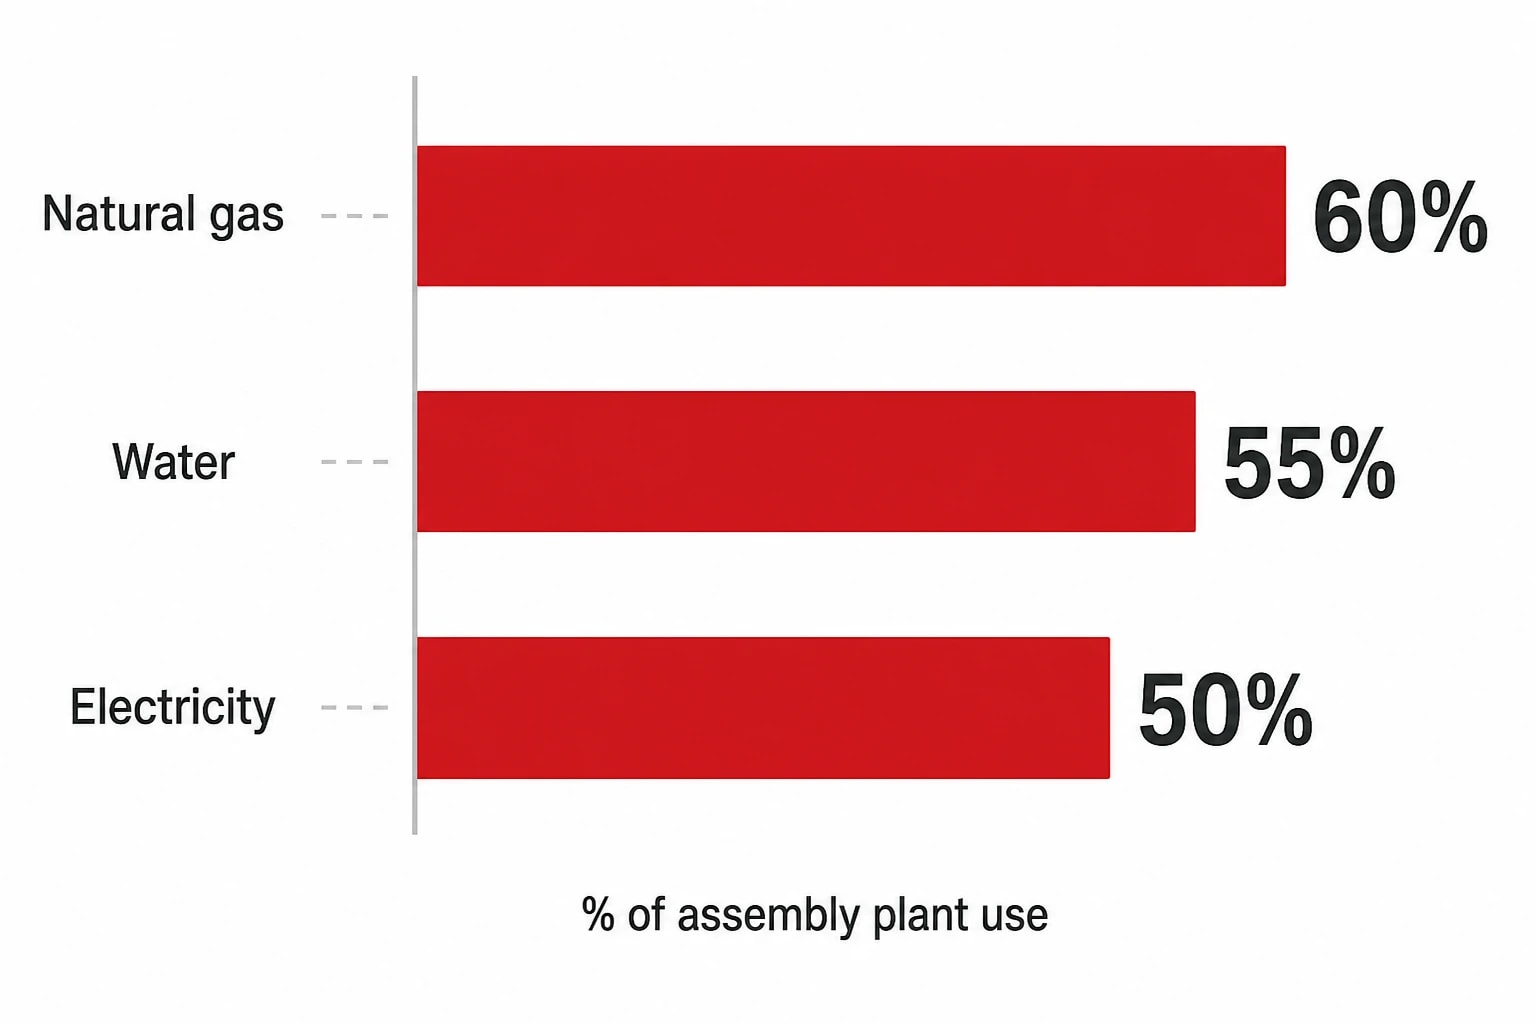
Stellantis reported that paint shops account for 60% of an assembly plant’s natural-gas use, 50% of its electricity use and 55% of its water use. A plant-wide carbon plan focused on general lighting upgrades or office HVAC will struggle to match the savings available from curing and air-handling systems.
An oven energy balance needs measured fuel and electricity data, operating hours, set points, production rate, exhaust temperature, burner performance and maintenance history. This identifies whether the priority is combustion efficiency, insulation and seal condition, exhaust-air recovery, load scheduling or conversion away from fossil fuel.
Spray booths consume electricity continuously
Spray booths are designed around finish quality, operator protection and volatile organic compound control. Their supply and extract systems move substantial volumes of conditioned air, often for long production windows. Fan power, make-up air temperature and air recirculation are material components of electricity and fuel consumption.
A booth operating at a fixed airflow rate in every production condition can consume more energy than the paint process requires. Demand-based ventilation controls can reduce fan speed during appropriate operating states, subject to process validation and environmental compliance. Variable-speed drives, damper condition, filter pressure drop and fan-curve performance affect the available saving.
Reduced airflow is not automatically permissible. Paint quality, overspray capture, worker exposure, fire precautions and VOC-abatement requirements define the usable operating envelope. A project must prove that envelope through trials and continuous monitoring before it becomes a standard operating condition.
Air handling multiplies both electricity and heat demand
Air supplied to booths and preparation areas often needs filtering, heating, cooling or humidification before reaching the process. This makes air handling a linked thermal and electrical load. A change in one part of the system can shift consumption elsewhere.
A fan project may reduce electrical demand while increasing heating demand if it disrupts recirculation or pressure balance. Similarly, heat recovery may improve gas performance but create excessive fan pressure drop. The automotive plant decarbonisation roadmap needs whole-system measurement rather than a list of isolated measures.
Identify where your plant is losing energy and quantify the savings potential — our audits map every heat source, sink, and waste stream in your facility.
Production-normalised baselines protect the business case
Use kWh per vehicle alongside total consumption
Total site energy is essential for carbon reporting, but it can obscure process performance. Lower production can reduce annual energy use while worsening plant efficiency because ovens, booths and utilities retain significant fixed loads.
The primary operational KPI should be kWh per vehicle, supported by separate Scope 1 and Scope 2 CO₂e-per-vehicle measures. Paint-shop managers should also track energy per painted body, as vehicle production may include variants that bypass part of the normal route or require different coating systems.
SMMT’s 25th Sustainability Report records that UK automotive Scope 1 and 2 energy per vehicle fell between 2000 and 2014, then rose as manufacturing became more energy-intensive and supply-chain disruption reduced production efficiency. Emissions per vehicle became less directly tied to energy use as manufacturers adopted lower-carbon fuels, renewable electricity and on-site generation.
A site can reduce reported Scope 2 emissions through electricity procurement while leaving avoidable kWh consumption in the paint shop. Energy intensity shows whether the process is becoming more efficient; carbon intensity shows the emissions effect of the energy source. Both belong in the investment case.
Separate fixed and variable loads
A useful baseline isolates energy that remains when throughput falls from energy that scales with painted bodies. Ovens in warm standby, booth ventilation, air-handling units, pumps, compressed air and water treatment can all retain demand outside active painting periods.
This produces a more realistic capital-project forecast. A project that removes a fixed thermal load can protect its return during weak production periods. A project that saves energy only per unit delivers most value at high utilisation. Finance teams need both cases before setting a hurdle rate or approving expenditure.
| Paint-shop measure | Principal energy effect | Production consideration | Investment case focus |
|---|---|---|---|
| Oven heat recovery | Reduces fuel used to heat make-up air | Dependent on oven operating hours and exhaust temperature | Annual recovered heat, maintenance access and summer bypass |
| Oven electrification | Reduces on-site combustion emissions | Requires resilient electrical capacity and validated cure profile | Grid connection, tariff exposure and carbon-intensity assumptions |
| Demand-based booth ventilation | Reduces fan electricity and air-conditioning load | Requires defined safe and quality-approved operating states | Shift pattern, fan control range and validation evidence |
| Fan and filter optimisation | Reduces fan power | Savings may vary with filter condition and line schedule | Measured pressure drop, fan curve and planned maintenance |
| Reduced bake process | Removes or combines curing steps | Requires coating-system qualification and model-programme alignment | Energy reduction, quality approval and conversion timing |
| Compressed-air leak and pressure management | Reduces supporting electricity load | Can be delivered with limited disruption | Leak survey, pressure stability and off-shift consumption |
Measure at asset level before approving capital
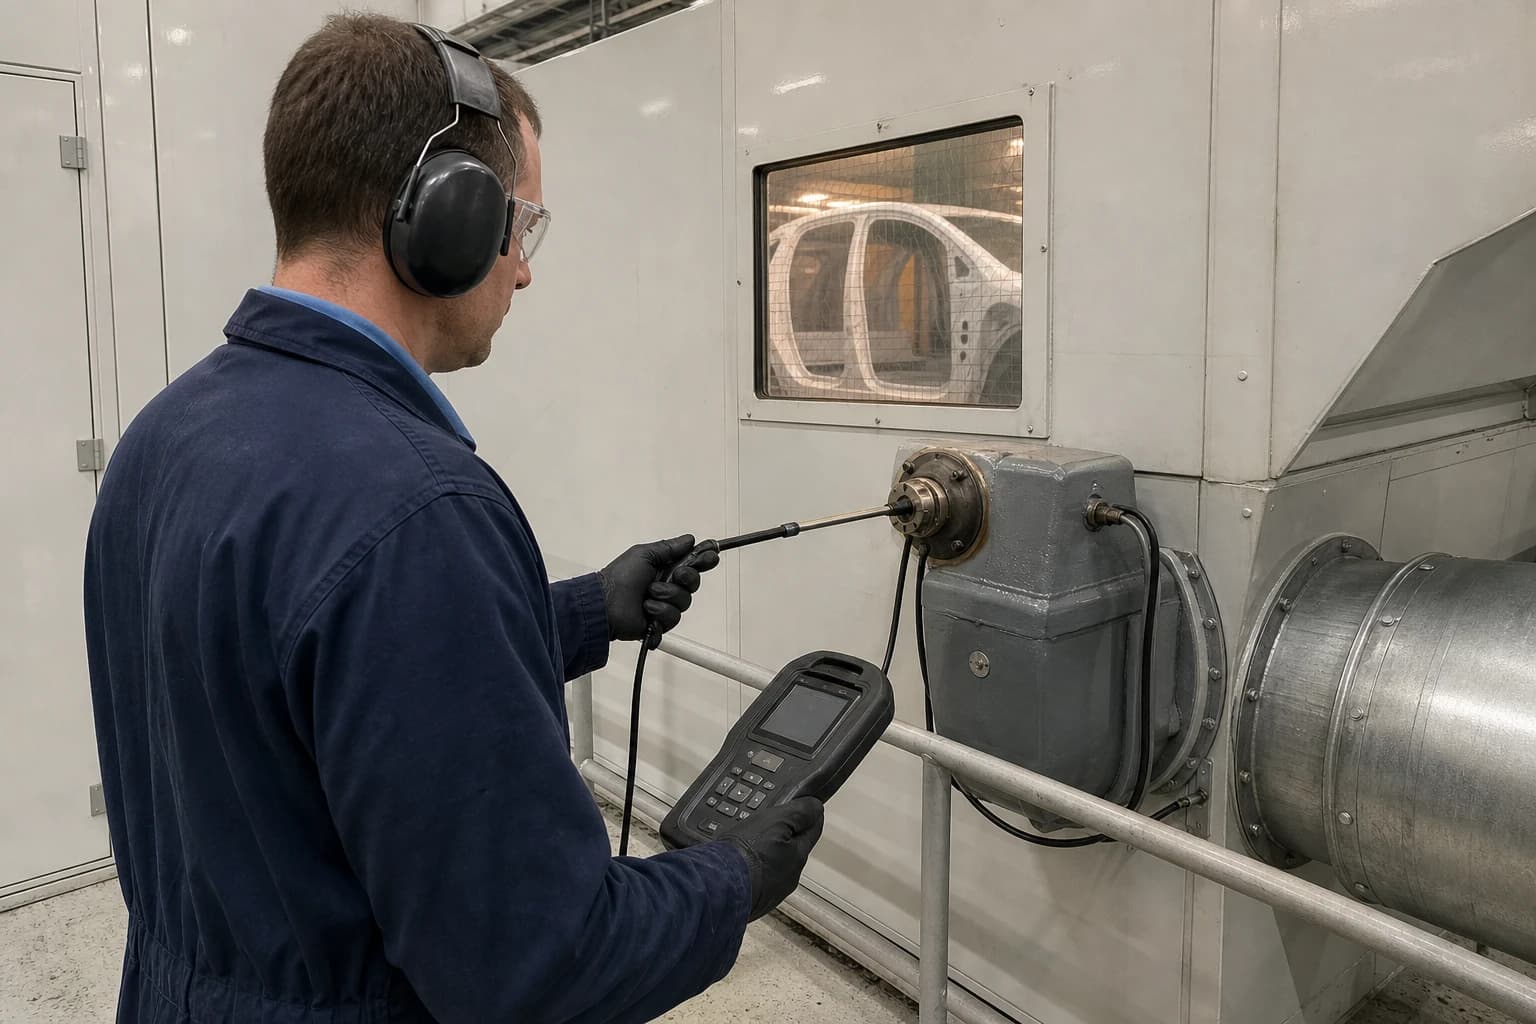
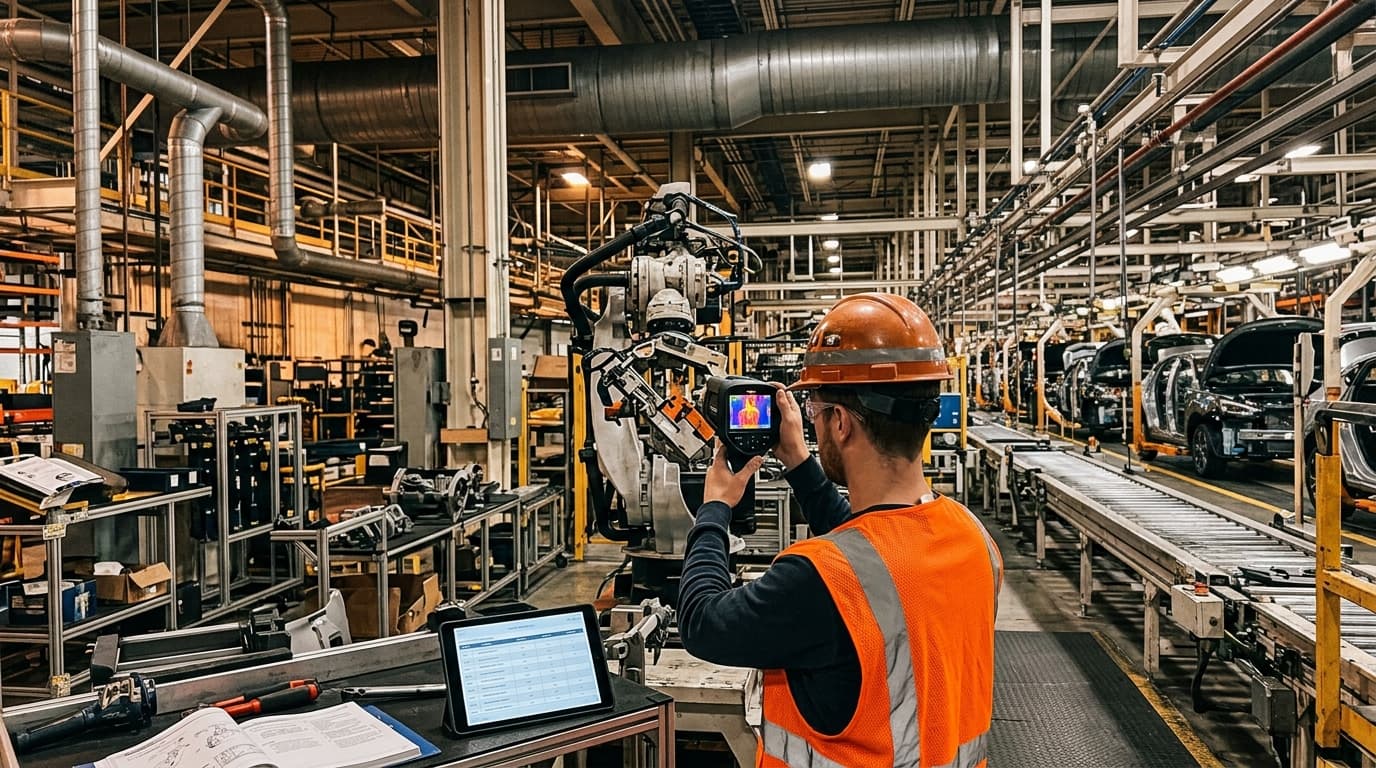
Monthly utility invoices cannot establish a reliable paint-shop project baseline. Audit teams should use sub-metering, temporary power analysers, gas measurement where practical, building-management-system data and production records. Thermal imaging can identify insulation defects and hot spots. Ultrasonic leak detection can reveal compressed-air losses that inflate compressor run time.
The metering plan should align timestamped energy data with painted bodies, oven state, booth mode, outdoor conditions and shift pattern. This distinguishes a genuine engineering gain from lower throughput, warmer ambient conditions or a temporary production stop.
Where capital should be directed first
Start with operational measures that expose the true baseline
The first tranche of an automotive plant decarbonisation roadmap should remove waste and establish control. Typical work includes correcting air leaks, repairing oven seals, restoring failed dampers, reviewing set points, replacing filters by pressure drop and reducing avoidable operation outside production.
These projects can be funded from maintenance or energy budgets and confirm the site’s real performance before larger investments. They also reduce the capacity required for later electrification. Installing electric heat for an inefficient process can create avoidable demand charges, connection costs and electrical-infrastructure upgrades.
EnerTherm Engineering’s automotive energy-audit work records average energy-cost reductions of 19%, a 1.9-year payback period and average annual reductions of 1,400 tonnes of CO₂. Individual paint shops differ materially by age, coating process, climate conditions, product mix and utility tariffs. These figures are a prompt for a measured site assessment, not a pre-approved saving forecast.
Fund process transformation at model-change windows
Large paint-shop projects gain value when they coincide with planned product change, coating qualification, major maintenance or line refurbishment. This is particularly true for reduced-bake processes.
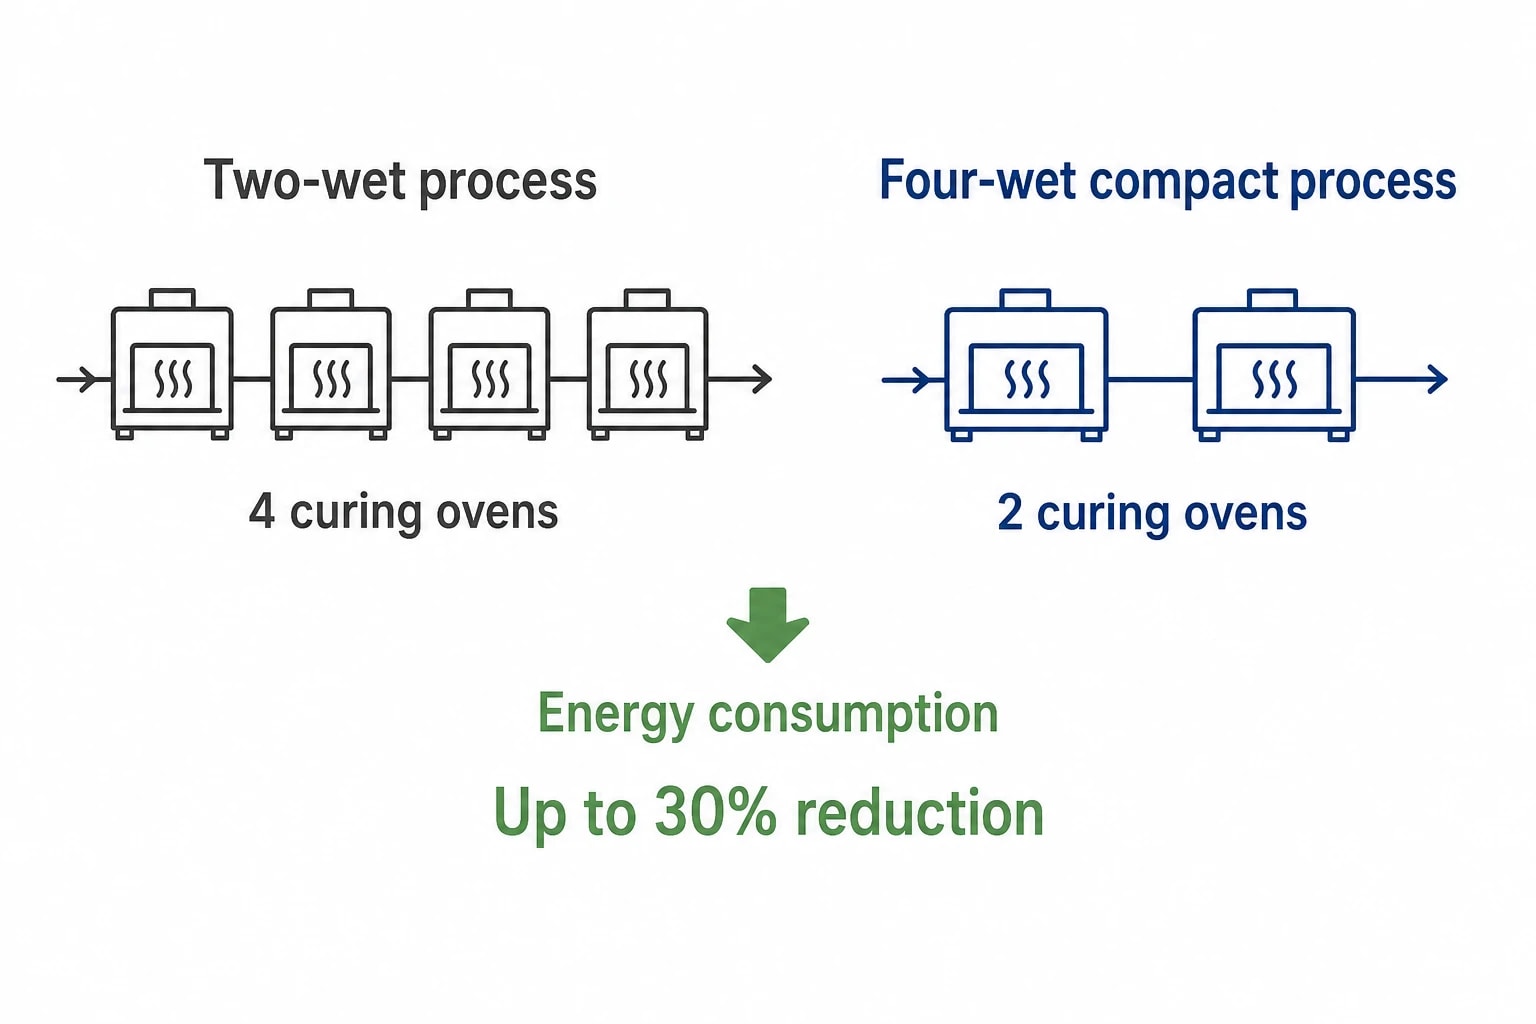
Stellantis reported a move from a conventional two-wet process with four curing ovens to a four-wet compact process with two curing ovens. The company stated that this can reduce energy consumption by up to 30%. It also reported a target of average paint-shop energy use of 321 kWh per vehicle by the end of 2025, following a 27% reduction against 2021.
For UK OEM and Tier 1 sites, timing is central. Process changes require paint-material approval, finish-quality trials, equipment changes and production planning. Capital requests should enter the programme gate early enough for assessment with the next model cycle, rather than being treated as standalone utilities projects after equipment scope has frozen.
Assess electrification as a system project
Electric curing can remove a major on-site combustion source, but the carbon and financial outcome depends on more than the oven. The assessment must address:
- available site electrical capacity and the cost and lead time of upgrades;
- peak demand created by simultaneous oven heat-up;
- production resilience during grid interruptions;
- cure-profile stability and product-quality validation;
- the electricity procurement strategy and expected Scope 2 accounting treatment;
- opportunities to reduce thermal demand before conversion.
SMMT’s Automotive Sustainability Report identifies significant growth in on-site renewable generation at UK manufacturing facilities. On-site generation can support a broader electricity strategy, but its output profile should not overstate the case for oven conversion. The audit needs hourly demand data and a clear view of whether generation coincides with production load.

Identify where your plant is losing energy and quantify the savings potential — our audits map every heat source, sink, and waste stream in your facility.
Build ROI around operational risk, not energy price alone
Include production protection in the financial model
A paint-shop decarbonisation project has two performance tests: it must save energy and maintain output. The cost-benefit model should include planned shutdown duration, commissioning sequence, spare-parts availability, temporary production arrangements, quality validation and the risk of rework or rejected bodies.
Project teams should set a production baseline before work begins. It should include first-time-through quality, paint defects, rework rate, bodies per hour and unplanned downtime. This gives operations management an equal voice in investment decisions and prevents an energy project being judged only by utility savings.
Use scenario analysis for uncertain conditions
Energy prices, vehicle volumes, grid carbon factors and production schedules vary. A single payback result can give false confidence. A stronger proposal presents a base case, a low-throughput case and a high-energy-price case.
The analysis should distinguish direct cash savings from carbon reductions. A project may have a modest energy-cost return but be needed to meet an OEM Scope 1 and 2 reduction target or protect access to a customer programme. Conversely, a low-carbon electricity contract can improve reported emissions while leaving high operating costs in place. Decision-makers need both values.
Measure and verify the delivered result
Measurement and verification should form part of capital approval. The project plan should specify the baseline period, meter boundaries, adjustment factors, reporting frequency, responsible owner and acceptance criteria. IPMVP measurement and verification principles provide a recognised framework for matching the method to the project.
For a booth-ventilation project, power metering and operating-state data may provide a direct result. For oven heat recovery, the verification plan may need gas, electrical and air-temperature measurements adjusted for production and ambient conditions. The method should be proportionate to the value and complexity of the measure.
Governance turns audits into an investable roadmap
ESOS requires auditable energy decisions
The Energy Savings Opportunity Scheme Regulations 2014, as amended, make energy assessment a governance issue for qualifying UK organisations. The Environment Agency describes ESOS as a mandatory scheme covering buildings, industrial processes and transport.
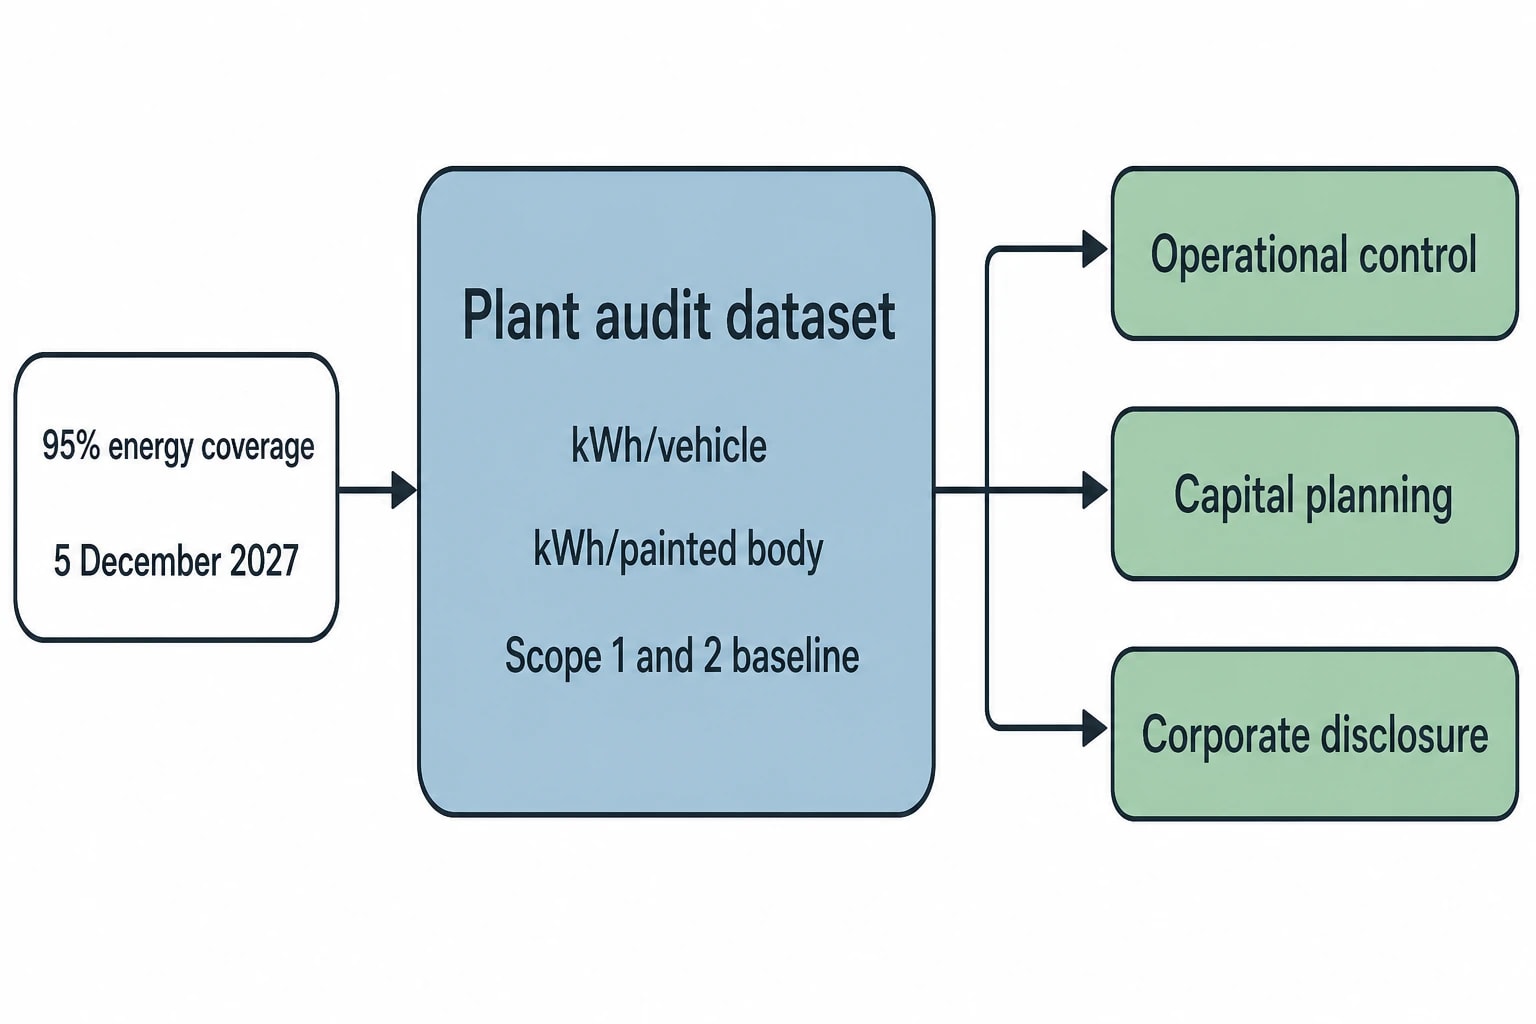
ESOS requires qualifying organisations to identify significant energy consumption covering at least 95% of total energy consumption, and to calculate energy-intensity ratios for industrial processes. For automotive facilities, kWh per vehicle and kWh per painted body provide a defensible way to meet that requirement while retaining operational relevance.
Phase 4 notification is due on 5 December 2027. The framework also requires participants to identify proposed measures that were not implemented and explain why. A documented capital roadmap records the measure, estimated saving, project owner, implementation date, dependency, status and reason for deferral.
SECR needs a consistent reporting trail
The Companies (Directors’ Report) and Limited Liability Partnerships (Energy and Carbon Report) Regulations 2018 require organisations in scope to disclose their methodology, comparative information, at least one intensity ratio and principal energy-efficiency actions. A plant-level audit trail helps group reporting withstand scrutiny.
The most effective reporting structure connects the same data set to three uses:
- Operational control through daily and weekly energy-intensity review.
- Capital planning through quantified opportunity registers and verified savings.
- Corporate disclosure through a documented Scope 1 and 2 baseline, intensity KPI and record of implemented action.
This avoids the split between an annual carbon report prepared by finance and an engineering project list managed by operations.
A seven-step route from paint-shop audit to investment plan
EnerTherm Engineering’s automotive methodology begins with an initial consultation to establish targets, constraints and available data. The site assessment maps energy use through paint ovens, booths, air handling, compressed air and connected utilities. Power analysers, ultrasonic leak detectors and thermal imaging convert assumptions into measured evidence.
Data analysis should produce production-normalised baselines and a ranked register of measures. The investment plan should separate no-cost and low-cost operational actions from medium-term refurbishment work and model-cycle capital projects. Implementation support keeps the engineering scope connected to production, maintenance and quality requirements. Ongoing monitoring, measurement and verification confirm that performance persists after commissioning.
This article reflects the independent analysis and editorial opinion of EnerTherm Engineering. Product names, trademarks, and brands mentioned belong to their respective owners. EnerTherm Engineering is not affiliated with, endorsed by, or a licensee of any third-party software or product mentioned unless explicitly stated.

Senior Process Engineer — EnerTherm Engineering
Masab Javed is a Senior Process Engineer at EnerTherm Engineering with extensive expertise in chemical process design, decarbonisation, and sustainable industrial solutions. He holds an MSc from TUM School of Management and a BEng in Chemical Engineering from NUST, with experience spanning ammonia production, CO2 capture, and semiconductor manufacturing optimisation.
