Why Automotive Plants Cut Compressed-Air Pressure to 70 psig
A DOE case study found press-line vacuum cups worked at 70 psig instead of 110 psig.
Compressed-air optimisation in automotive production is the systematic reduction of air-system pressure and energy use while maintaining the flow, air quality, force and response required at validated points of use.
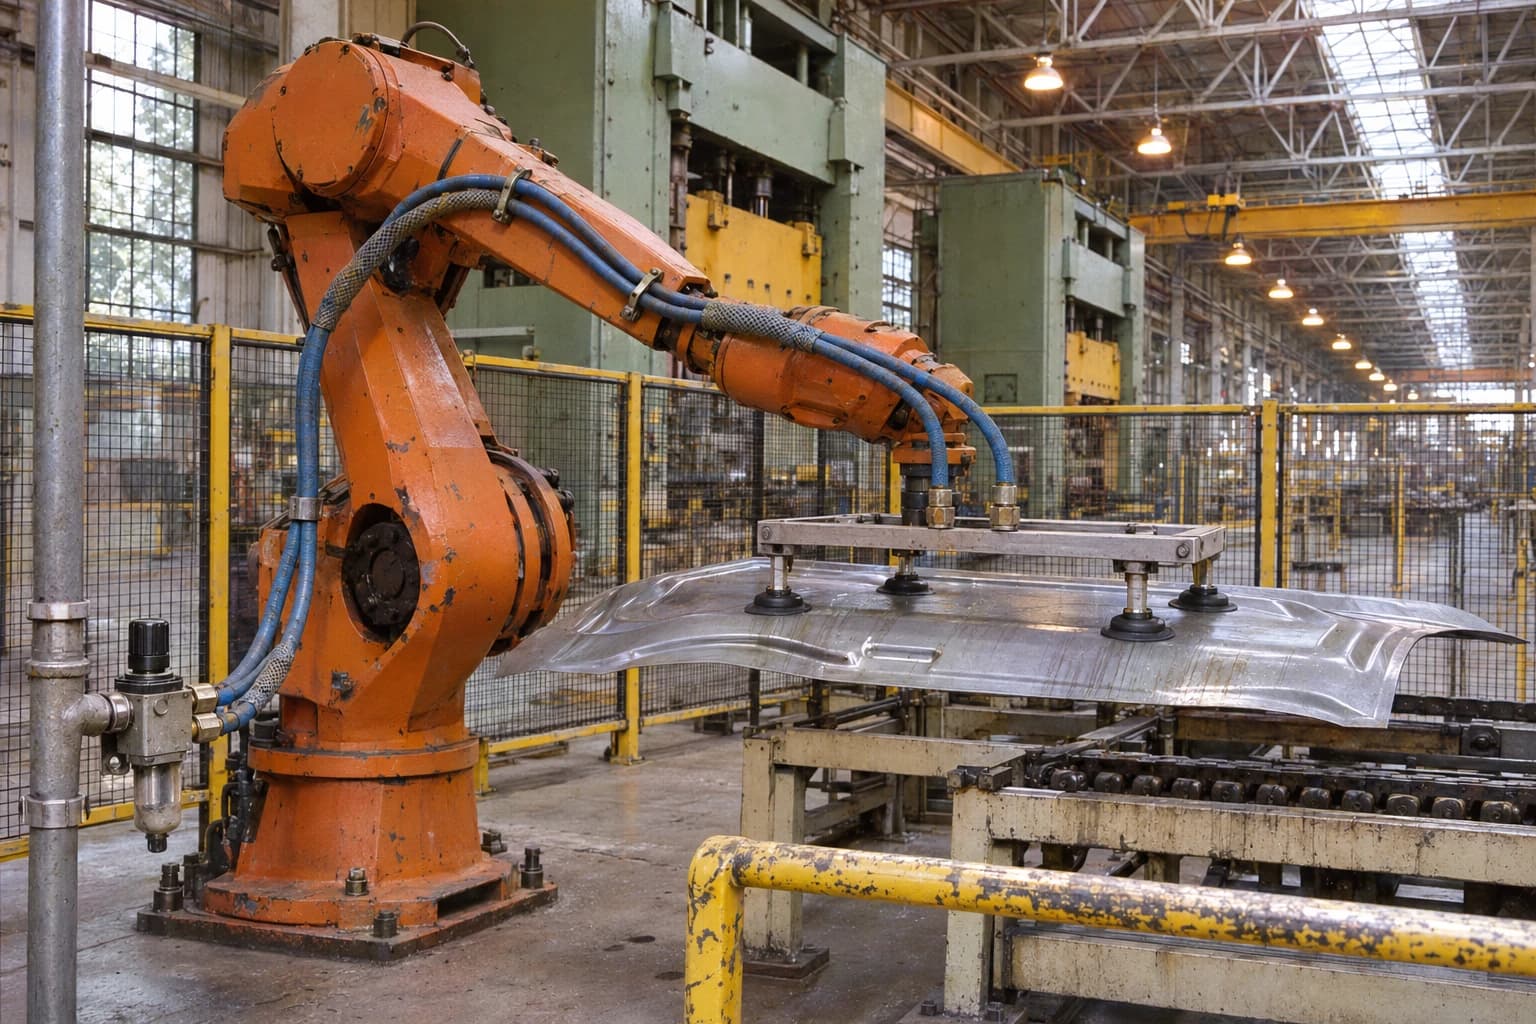
At Ford’s Woodhaven Stamping Plant in Michigan, some robot press-line vacuum venturi cups operated satisfactorily at 70 psig rather than 110 psig. The finding formed part of a wider improvement programme that allowed the plant to take an 800 hp compressor offline, remove several high-pressure satellite compressors and improve the efficiency of the remaining plant.
For automotive facilities teams, 70 psig is a useful reference point rather than a universal target. It can suit many robot, fixture and general plant-air applications once leakage, restrictions and local pressure losses have been addressed. The correct setpoint remains the lowest pressure that supports safe, repeatable production at the most demanding validated endpoint.
SAE technical paper 2012-01-0327 puts the potential scale in context. It reports that compressed-air systems can account for 5% to 20% of energy consumption in automotive plants. Its case study of a 360,000 sq ft automotive-interiors factory recorded annual electricity use of 1,414,000 kWh to supply an average 800 cfm from two 150 hp rotary-screw compressors.
Compressed air optimisation in automotive plants: why pressure matters
Body-in-white lines, stamping presses, paint shops, trim areas and final-assembly cells use compressed air differently. Pneumatic cylinders position tooling. Grippers clamp components. Vacuum generators handle panels. Air tools support assembly and maintenance. Control air operates valves and instrumentation. Paint operations can require carefully conditioned process air.
A central compressor system often runs at a pressure high enough to satisfy the most demanding, distant or poorly supplied use. That approach masks local problems by making all users pay for one exception. It also drives consumption above the level required for much of the site.
Higher pressure increases leakage and artificial demand
Compressed-air leakage rises with pressure. Hoses, quick-connect couplings, valve manifolds, cylinder seals and robot dress packs lose more air when supplied above the pressure required by the application.
Higher pressure also creates artificial demand: additional air consumed by unregulated uses when the system operates above production’s actual pressure requirement. Blow-off devices, open tubes and poorly controlled pneumatic equipment are common contributors. Reducing average system pressure cuts this avoidable demand and the work done by compressors.
The US Department of Energy compressed-air guidance associated with the Woodhaven project gives a practical rule of thumb for systems in the 100 psig range: a 2 psi reduction in average system pressure can reduce energy consumption by around 1%. Plant performance and control strategy determine the actual result, so this estimate should inform an audit rather than replace measurement.
Pressure at the actuator matters more than pressure at the compressor
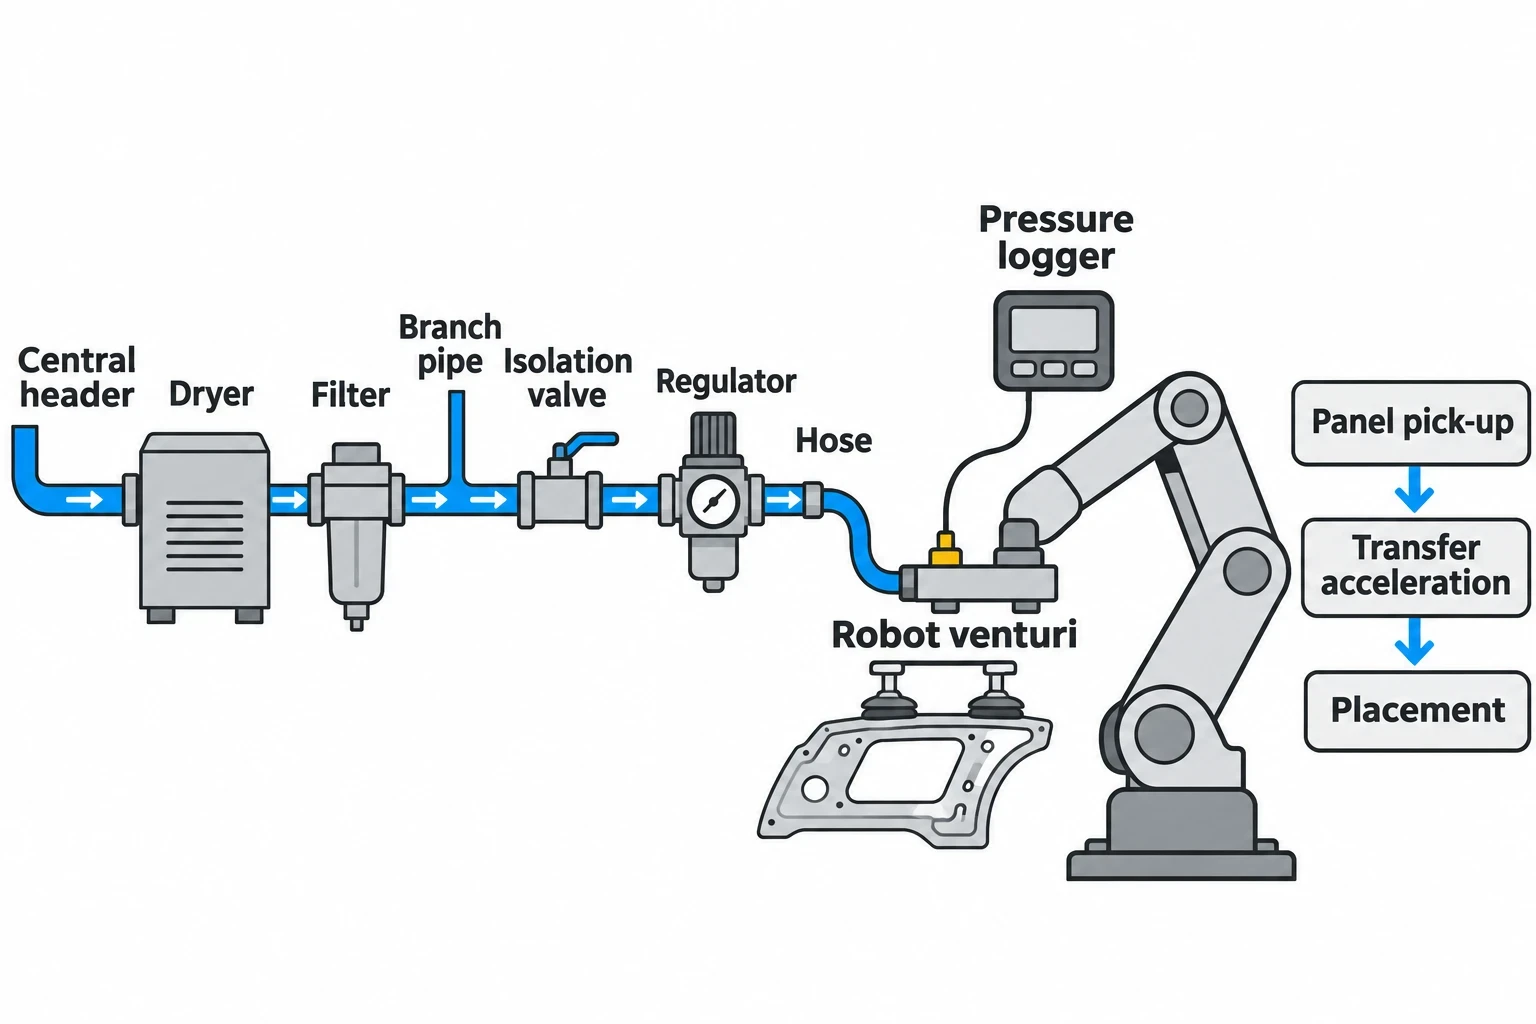
A compressor-room gauge cannot confirm whether a gripper, cylinder or venturi has enough pressure when it operates. Pressure can fall across dryers, filters, undersized branch pipework, isolation valves, regulators, hoses and fittings.
A robot may appear to need a higher header pressure when the real issue is a restrictive filter or a branch line that cannot supply a short, high-flow demand. Raising the central header increases energy use throughout the factory while leaving the local restriction in place.
Pressure logging should therefore take place at the critical endpoint during the demanding part of the machine cycle. For a press-shop robot, that could mean panel pick-up, transfer acceleration and placement. For a clamp fixture, it could mean the point at which the cylinder must prove its position before the next operation begins.
Identify where your plant is losing energy and quantify the savings potential — our audits map every heat source, sink, and waste stream in your facility.
Why 70 psig can suit automotive equipment
The case for 70 psig rests on application testing, not a generic air-system rule. Individual tools and processes have different needs, and the point-of-use requirement must be proven under production conditions.
Robot vacuum venturi cups on press lines
At Woodhaven, robots previously received air from seven small rotary-screw satellite compressors operating at 110 psig. The project team established that some vacuum venturi cups could perform satisfactorily at 70 psig from the main header.
Venturi generators create vacuum by using compressed air through a nozzle. Their suitability depends on generator design, supply pressure, vacuum level, cup material, seal condition, panel geometry and handling-cycle timing. Oily surfaces, perforated panels, curved stampings and rapid robot acceleration can alter the result.
A press shop should validate a lower pressure across the full operating envelope, including the fastest production rate, model changes, varied panel conditions, cup wear and recovery after a controlled interruption. Relevant acceptance checks include missed picks, dropped panels, part damage, cycle-time loss and robot faults.
Pneumatic cylinders, clamps and grippers
Cylinders and grippers require sufficient pressure to generate force at the required speed. The necessary pressure depends on actuator bore, load, stroke, friction, valve flow capacity and local pressure drop. A static bench test can understate the demand seen during a live production cycle.
Excess pressure can increase impact at the end of a cylinder stroke and add unnecessary air consumption. It can also conceal worn seals, poor cushioning or inadequate valve sizing. Lowering pressure should therefore accompany inspection of mechanical condition and cycle performance.
A practical assessment records:
- Supply pressure at the valve island and close to the actuator
- Pressure during simultaneous operation of nearby equipment
- Clamp confirmation and fault data
- Cycle time at normal and peak production rate
- Air consumption during production, standby and non-production periods
Paint-shop and process-air exceptions
Paint shops need a separate engineering review. Atomising air, control air and other process-air supplies may have strict requirements for pressure stability, oil content, moisture and particulate contamination. Coating quality, application equipment specifications and the plant’s approved process parameters take precedence over a general header target.
A 70 psig general plant header can coexist with dedicated regulated branches and local air treatment where paint-process equipment requires different conditions. The objective is to avoid operating the entire distribution system at an elevated pressure for a limited, validated application.
The faults that push automotive plants towards excessive pressure
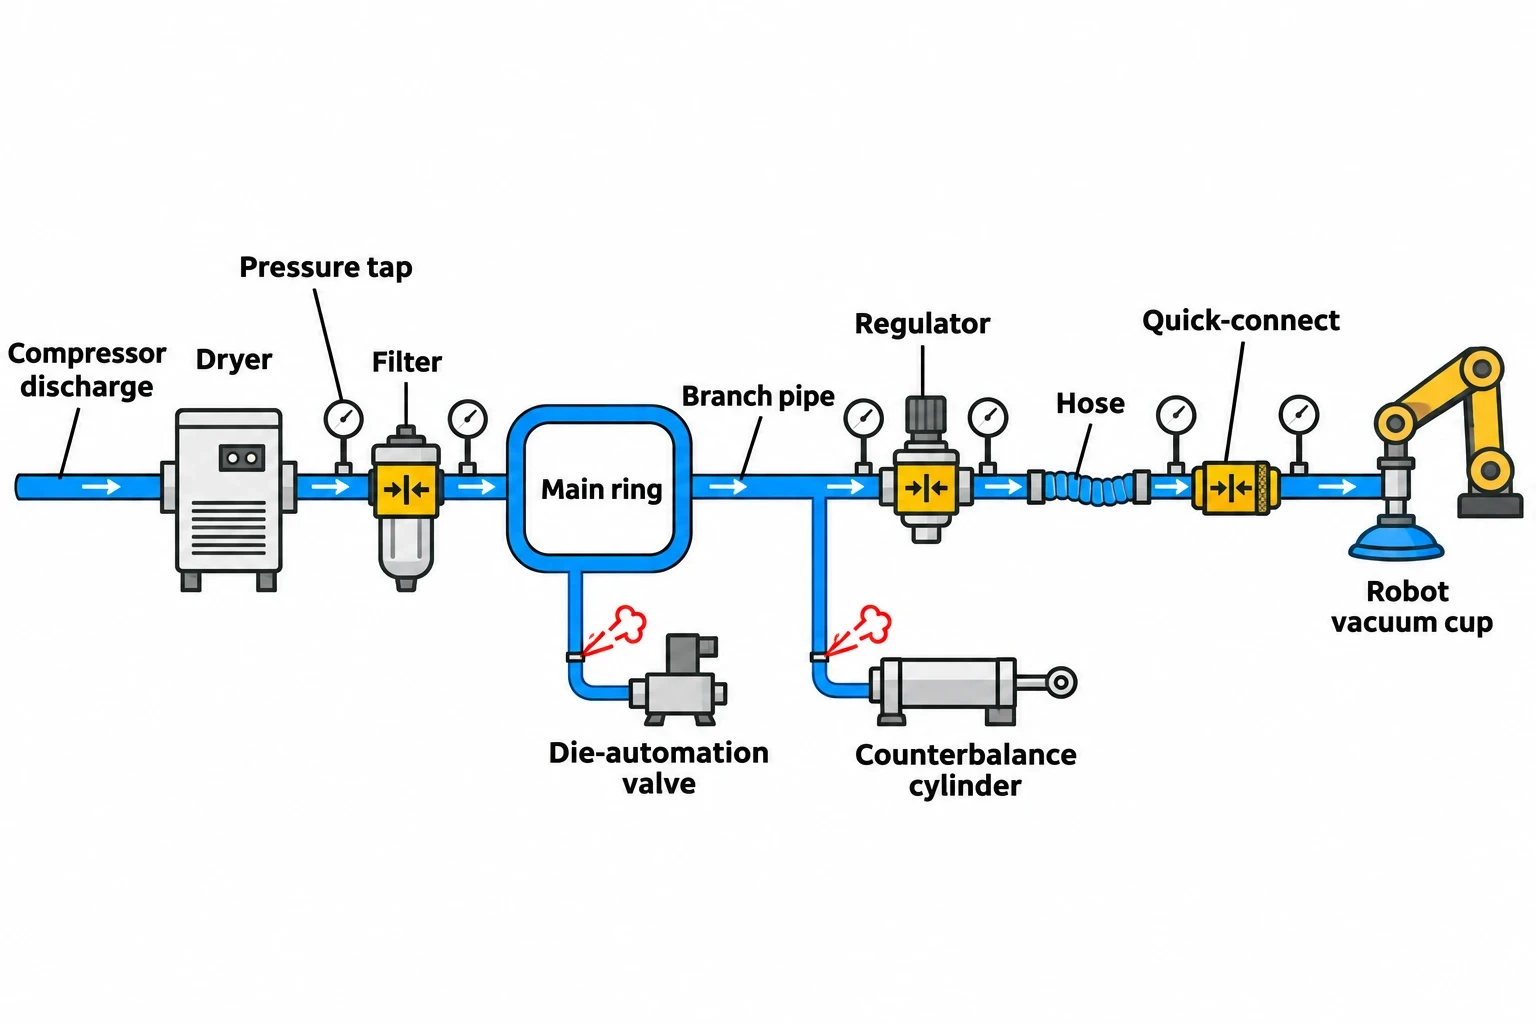
High compressor discharge pressure is often a response to poor distribution performance. An effective compressed-air optimisation audit identifies the root cause before changing the compressor setpoint.
Leakage creates an expensive off-shift baseload
Automotive factories have many potential leak points: flexible robot hoses, quick-connect fittings, pneumatic valve seals, press counterbalance systems, cylinder rods and manual drain valves. These losses continue during breaks, weekends and planned shutdowns unless the relevant branch is isolated.
At Woodhaven, the project team found leakage in the distribution system and stamping-press counterbalance cylinders. The team formed a leak-detection and correction group, then replaced seals on die-automation valves identified as a major leakage source.
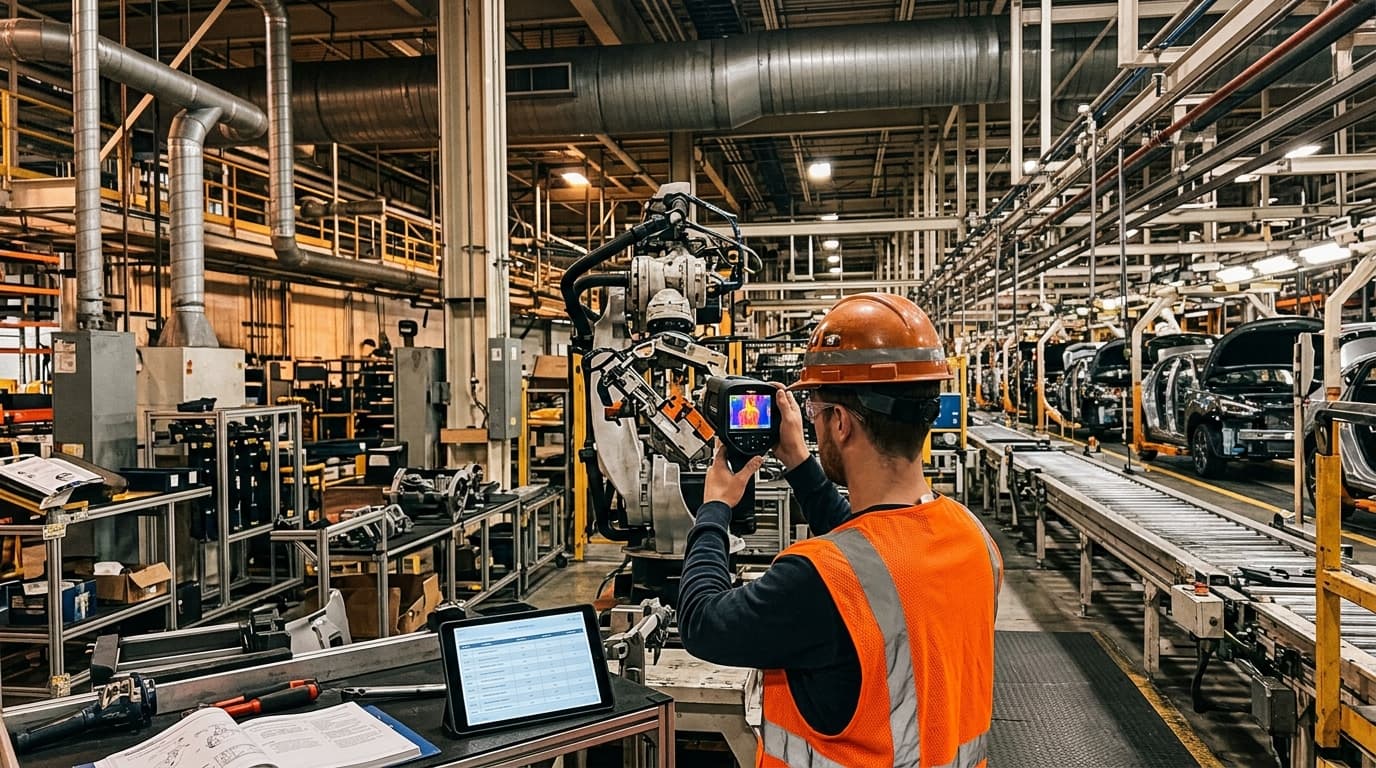
Ultrasonic leak detection provides a structured way to find and prioritise leakage. Each finding should have a location, estimated severity, responsible owner, repair date and confirmation of repair. Trend data from overnight compressor kW or air flow provides a cross-check. A large non-production baseload warrants investigation before more compressor capacity is considered.
Restrictions turn local faults into site-wide energy use
Filters with high differential pressure, undersized regulators, restrictive couplings, congested hoses and poor branch-pipe sizing can all prevent adequate pressure reaching an endpoint.
The Woodhaven project also replaced flow-measuring orifice plates with lower-loss venturis and averaging pitot tubes. This shows why measurement equipment belongs in the audit scope. A flow meter that causes significant pressure loss can lead operators to increase compressor discharge pressure, increasing energy use across the plant.
Inspection should cover the full route from compressor discharge to point of use, including dryers, filters, main rings, branches, regulators, hoses and quick-connect fittings. The audit should compare pressure upstream and downstream of suspected restrictions under real demand.
Storage and compressor controls must match the load
Pressure stability depends on more than compressor capacity. Fixed-speed and variable-speed machines need coordinated control bands. Poor sequencing can cause machines to load and unload excessively or operate inefficiently at part load.
Storage also requires a clear purpose. Wet storage close to compressors can support stable compressor control. Dry storage close to intermittent, high-flow uses can reduce local pressure dips. A press line, robot cell and assembly line may have different transient demand profiles.
The design aim is adequate pressure at the critical endpoint without holding the entire site at that level.

Identify where your plant is losing energy and quantify the savings potential — our audits map every heat source, sink, and waste stream in your facility.
A controlled method for reducing compressed-air pressure
A pressure-reduction programme needs production, maintenance, quality and energy teams to agree the test area, data collection and acceptance criteria before the first setpoint change.
Establish the real minimum pressure
Choose a representative production area and identify the equipment most likely to constrain pressure reduction. Monitor that equipment through shift start, full production speed, simultaneous robot movement, model changeover and peak press activity.
Log header pressure, branch pressure, end-use pressure, air flow and compressor electrical demand. Data intervals need to capture short pressure dips created by automated machinery rather than only average values.
The validation must include manufacturing outcomes. Robot vacuum systems need checks for pick failures and handling faults. Fixtures need clamp confirmation and repeatable cycle time. Paint-related supplies need assessment against the site’s existing quality criteria.
Reduce in increments and correct faults
Small staged adjustments reveal the first genuine constraint without introducing uncontrolled production risk. The team should stabilise the system at each setting, assess logged data and confirm quality before making the next reduction.
- Repair priority leaks and isolate air use during non-production periods where appropriate.
- Remove restrictive components and confirm filter condition.
- Review compressor controls, storage and dryer pressure loss.
- Identify applications with a proven need for higher pressure.
- Reduce the general header setpoint in controlled increments.
- Validate pressure, production output, quality and downtime at full demand.
- Install local regulation or a dedicated branch for confirmed exceptions.
This sequence prevents a site-wide pressure increase from becoming the permanent answer to a single poorly supplied cell.
Measuring savings from compressed-air optimisation automotive projects
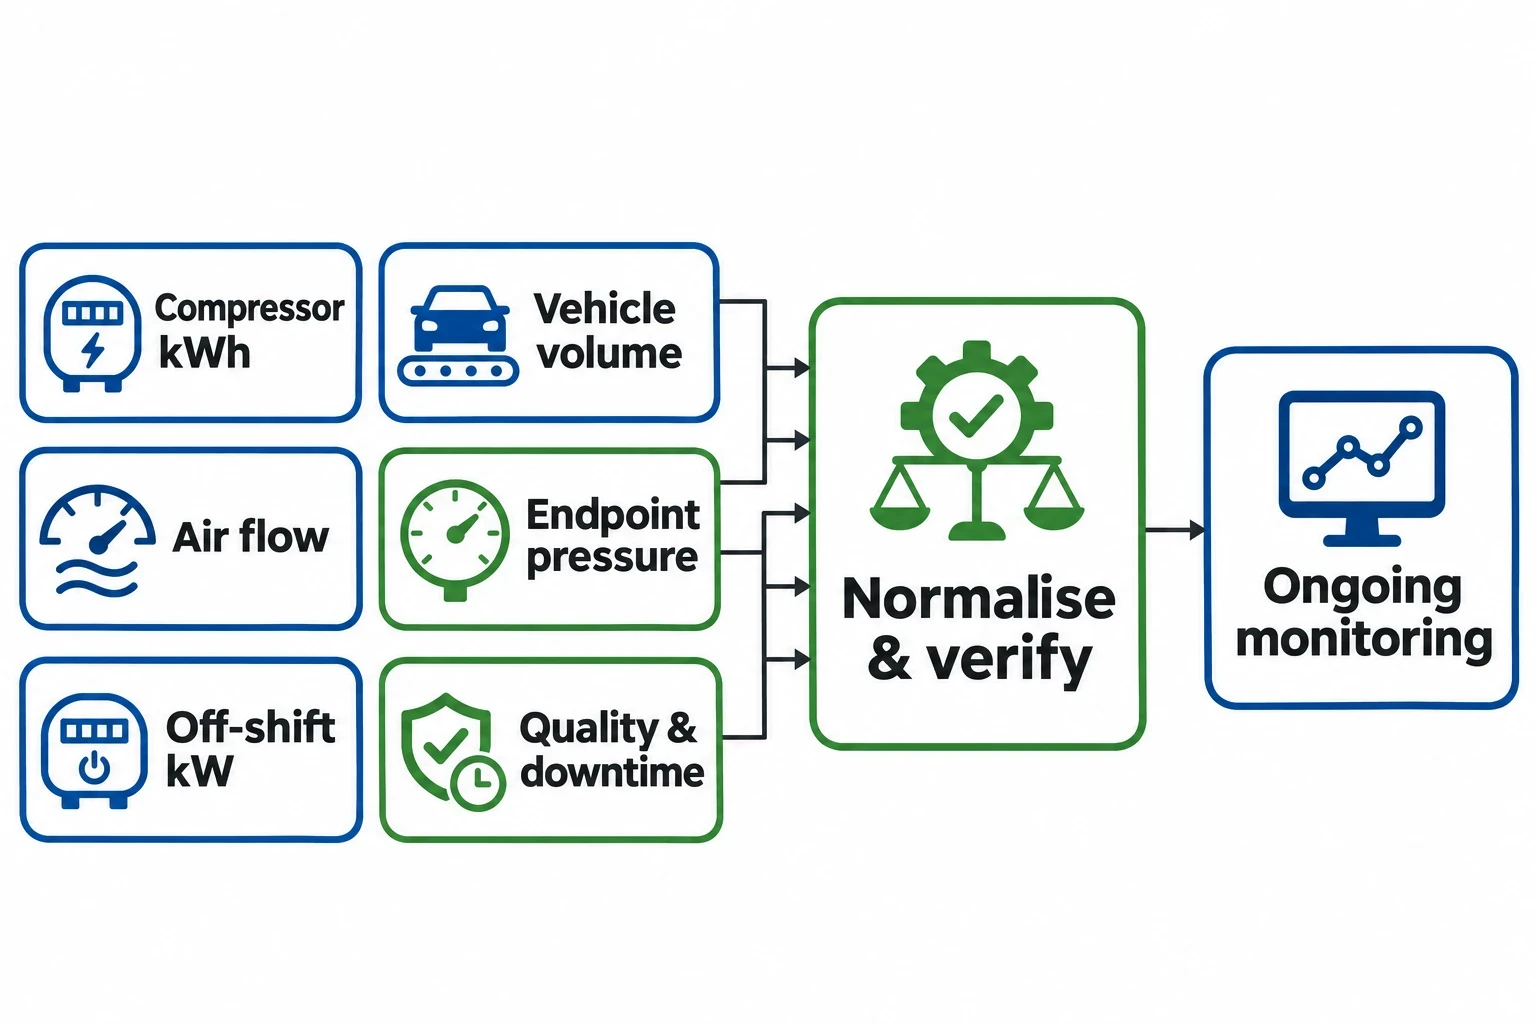
Compressor kWh is essential, but it does not explain savings on its own. Vehicle volume, product mix, shifts and line speed can alter air demand. Automotive energy managers need production-normalised metrics alongside electrical data.
| Measure | What it shows | Automotive use |
|---|---|---|
| Compressor kWh per vehicle | Electricity used for each vehicle produced | Separates energy improvement from changing output |
| Average and peak air flow | System demand and transient load | Identifies leakage, artificial demand and peak events |
| Pressure at critical endpoints | Pressure available to equipment | Confirms production equipment remains adequately supplied |
| Non-production compressor kW | Off-shift baseload | Highlights leakage and equipment left consuming air |
| Quality and downtime records | Production effect of the change | Protects panel handling, assembly and paint quality |
A measurement and verification plan should define the baseline period, meter locations, production-normalisation method, excluded events and reporting period before implementation. It should also identify operational changes that may affect results, such as a new model programme, altered shift pattern or plant shutdown.
Monitoring should continue after the project closes. Filters load, seals wear, regulators drift and temporary hoses become permanent installations. A pressure target retains value only when maintenance teams can see whether the system still delivers the required endpoint pressure with the expected compressor energy.
ESOS Phase 4 and compressed-air energy audits
For qualifying UK undertakings, compressed-air optimisation should form part of the industrial-process assessment under the Energy Savings Opportunities Scheme Regulations 2014, as amended. Phase 4 applies to organisations that meet the large-undertaking test on 31 December 2026, with notification of compliance due by 5 December 2027.
The Environment Agency requires organisations to calculate energy-intensity ratios for industrial processes as part of Phase 4. For automotive manufacturing, compressor kWh per vehicle is a useful operational measure where vehicle data is available. It connects compressed-air performance to the activity that creates demand and avoids mistaking lower production for energy efficiency.
An ESOS-compliant audit must, so far as reasonably practicable, use verifiable energy-consumption data measured over a 12-month period beginning no earlier than 6 December 2022. It must analyse energy consumption and efficiency, identify energy-saving opportunities and include site visits.
ISO 50001 certification can provide a compliance route where it covers the required significant or total energy consumption. For Phase 4, the certification must be issued on or after 6 December 2023 and remain valid on the compliance date.
For an automotive plant, the evidence pack should connect the compressor plant to the demand created in stamping, body-in-white, robotic assembly and paint operations. It should record pressure profiles at critical endpoints, leakage findings, identified restrictions, trial results, production checks and measured energy outcomes.
This article reflects the independent analysis and editorial opinion of EnerTherm Engineering. Product names, trademarks, and brands mentioned belong to their respective owners. EnerTherm Engineering is not affiliated with, endorsed by, or a licensee of any third-party software or product mentioned unless explicitly stated.

Senior Process Engineer — EnerTherm Engineering
Masab Javed is a Senior Process Engineer at EnerTherm Engineering with extensive expertise in chemical process design, decarbonisation, and sustainable industrial solutions. He holds an MSc from TUM School of Management and a BEng in Chemical Engineering from NUST, with experience spanning ammonia production, CO2 capture, and semiconductor manufacturing optimisation.
