Identifying Energy Hotspots to Cut 15-30% Industrial Waste
An ISO 50006 framework to isolate baseload waste and justify UK IETF capital funding.
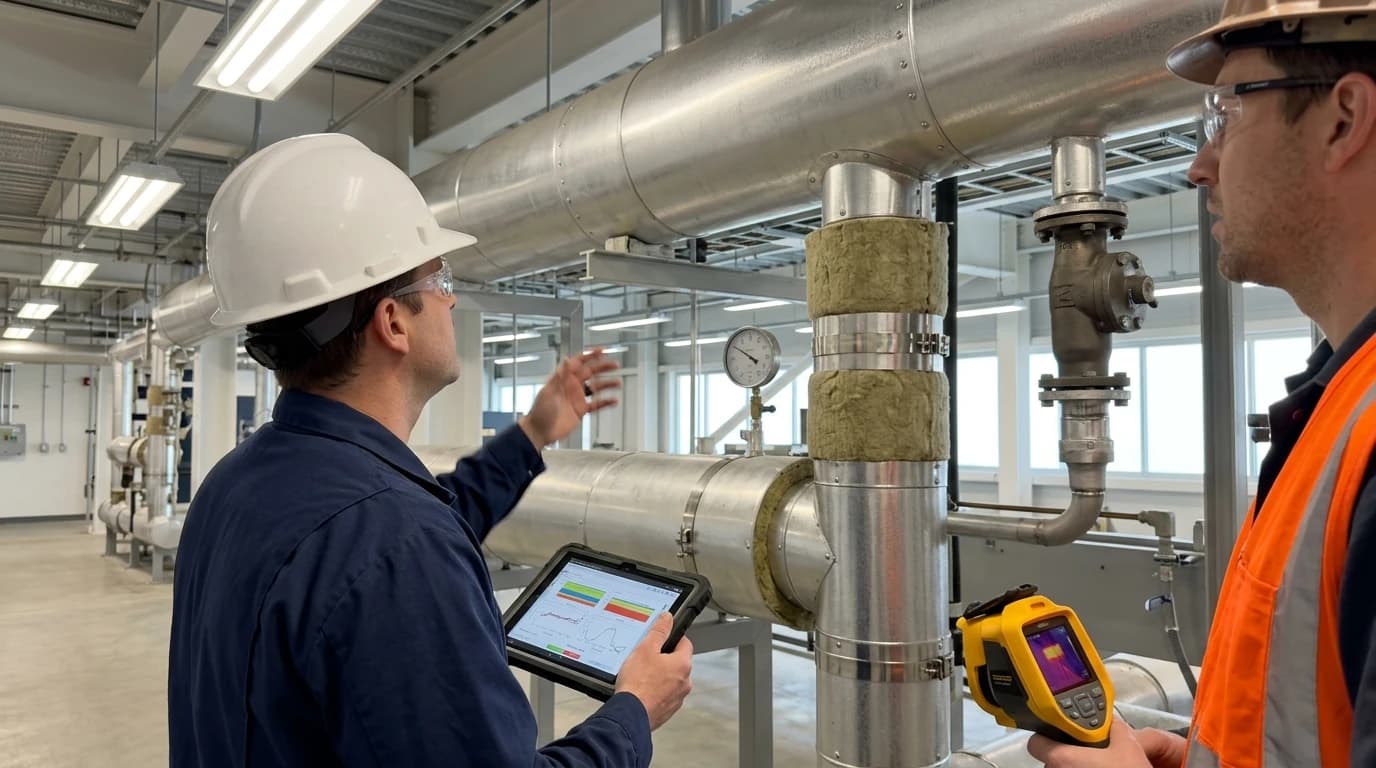
Identifying energy hotspots in manufacturing is a systematic engineering methodology used to isolate, quantify, and map areas of disproportionate or non-productive utility consumption across factory assets, production lines, and plant infrastructure. By pinpointing exactly where, when, and why energy is consumed without adding value to the final product, facility managers can eliminate structural waste and dramatically lower operational expenditures.
In large-scale manufacturing environments, up to 15% to 30% of total utility consumption occurs during non-production hours or within inefficient sub-processes. These inefficiencies represent phantom loads, which are continuous energy draws that persist even when factory output ceases. Finding and rectifying these hidden energy drains requires a transition from high-level utility billing analysis to granular, real-time data acquisition and rigorous statistical baseline modelling.
Defining the Challenge of Industrial Energy Waste
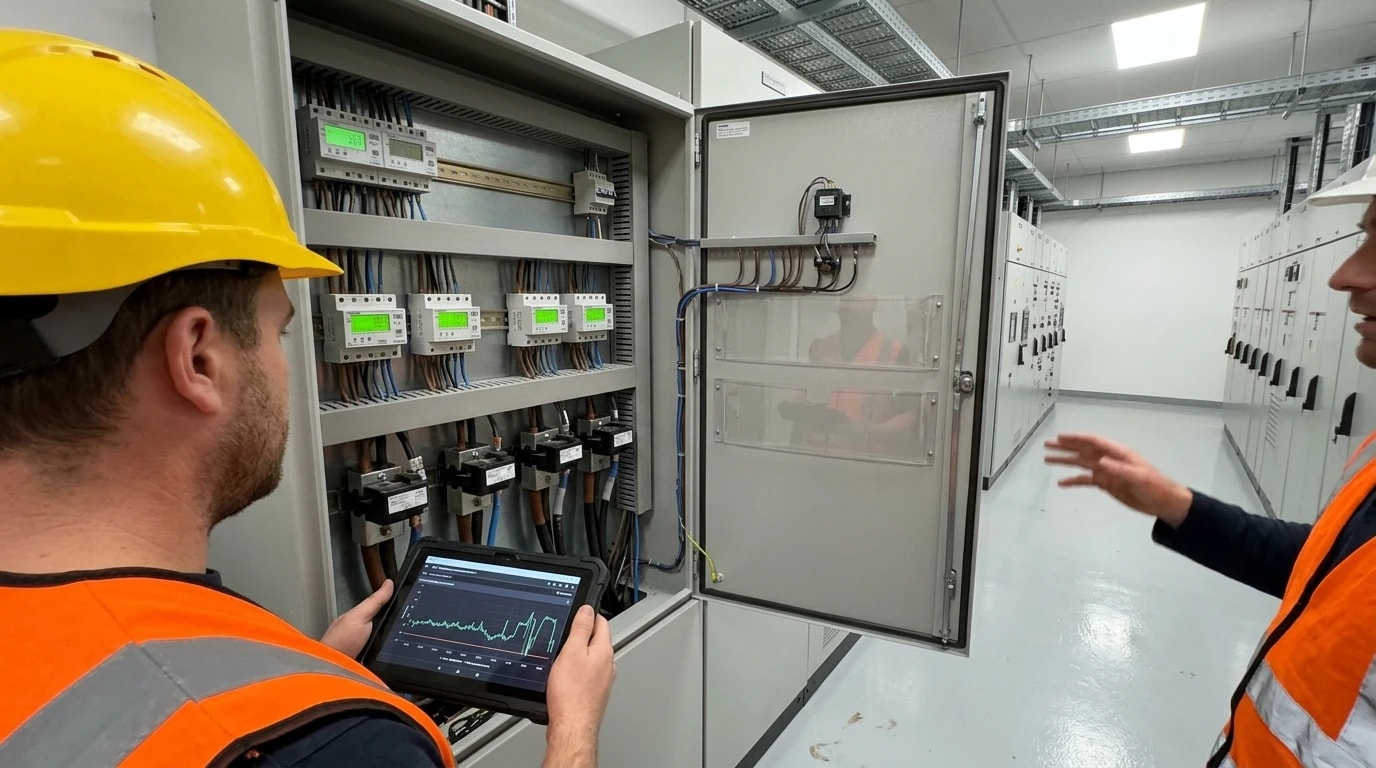
Many industrial facilities operate with a significant blind spot regarding their actual energy distribution. While utility meters record total consumption at the site boundary, they fail to reveal the specific assets or operational behaviours that drive peak demand or sustain high baseline consumption.
The Cost of Phantom Loads and Baseload Inefficiencies
Baseload energy is the minimum amount of power required to keep a manufacturing facility running during non-operational periods, such as weekends, maintenance shutdowns, or shift changeovers. In an optimised plant, this baseload should represent a small fraction of active production energy. However, phantom loads frequently inflate this baseline to unacceptable levels.
Common contributors to bloated baseloads include:
- Uncontrolled compressed air networks suffering from distributed pipe-joint leakage.
- Auxiliary cooling water pumps and ventilation systems left running at full speed during idle shifts.
- Steam distribution systems with failed-open thermodynamic traps, leading to constant thermal losses.
- Oversized hydraulic power units maintaining system pressure when machines are in standby mode.
- Trace heating and space conditioning systems operating in unpopulated or unconditioned storage areas.
Why Traditional Spreadsheet Tracking Fails
Many manufacturing sites still rely on manual weekly or monthly meter readings entered into spreadsheets. This approach presents several fundamental problems:
- Time Lag: Spreadsheet analysis is historical. By the time an energy spike is identified, the underlying malfunction or operational error may have occurred weeks prior, wasting significant financial resources.
- Lack of Production Context: Raw utility data lacks production alignment. Without correlating energy consumption directly to batch numbers, product types, or raw material variations, it is impossible to determine whether an increase in energy use is due to higher production volume or a declining equipment efficiency trend.
- Averaging Effects: Monthly billing data hides transient peaks. A massive, short-duration power draw that triggers expensive peak-demand penalties will be smoothed out over a 30-day average, leaving energy engineers without the granular visibility needed to implement load-shifting strategies.

Omni Vision delivers turnkey utility metering, CO2 tracking, and AI-powered production KPI intelligence — giving you real-time dashboards and actionable insights across your entire facility.
Implementing ISO 50002 Audit Protocols for Baseload Analysis
To systematically address these phantom loads, facility teams must employ standardised audit techniques. The ISO 50002 standard provides a structured framework for conducting industrial energy audits, defining the precise measurement and analytical methods required to isolate baseload waste.
Quantifying the Non-Productive Base Load
Under the ISO 50002 methodology, the first step is to establish a clear boundary for the energy audit. This involves mapping all energy inputs and outputs across the facility. To isolate phantom loads, audits must focus heavily on non-productive periods.
By analysing high-resolution interval data (ideally at 15-minute intervals or less) during planned weekend shutdowns or holiday closures, engineers can construct a "zero-production profile". This profile establishes the absolute floor of facility energy consumption. Any power, gas, or steam demand recorded above the safety-critical utilities (such as emergency lighting, fire suppression, or essential climate control for raw materials) constitutes a phantom load that can be targeted for elimination.
| Utility Stream | Common Baseload Waste Mechanism | Diagnostic Indicator (ISO 50002) |
|---|---|---|
| Electricity | Idling motors, unoptimised HVAC, transformers | High kW draw during scheduled weekend shutdowns |
| Compressed Air | Joint leaks, open blow-offs, unregulated purging | Continuous compressor cycling with zero production |
| Steam | Failed-open steam traps, uninsulated valves | High condensate return temperatures, boiler short-cycling |
| Natural Gas | Boiler cycling, space heating in empty zones | Constant gas consumption overnight during non-production |
| Process Water | Open-loop cooling, seal water leaks, overflow valves | Steady volumetric flow rate (m3/h) during idle states |
| Fuel Oil | Thermal fluid heaters idling, generator heater block draws | Unscheduled fuel depletion in auxiliary storage tanks |
Common Sources of Manufacturing Phantom Loads
During physical walk-throughs aligned with ISO 50002, energy engineers frequently uncover mechanical and operational inefficiencies that escape general maintenance programmes. For instance, a single 3 mm leak in a compressed air line operating at 7 bar can waste over 30,000 kWh of electricity annually. When multiplied across a sprawling automotive or packaging plant with hundreds of pneumatic connections, compressed air leaks alone can account for up to 10% to 15% of a site's total electrical baseload.
Similarly, steam distribution systems are highly prone to degradation. Steam traps are designed to discharge condensate while retaining live steam. On average, industrial plants that do not perform routine diagnostic testing suffer from a 15% to 20% steam trap failure rate. Failed-open traps release valuable thermal energy directly into the condensate return system or the atmosphere, forcing boilers to burn excess fuel oil or natural gas to maintain process temperatures.
Establishing Baselines and EnPIs with ISO 50006:2023
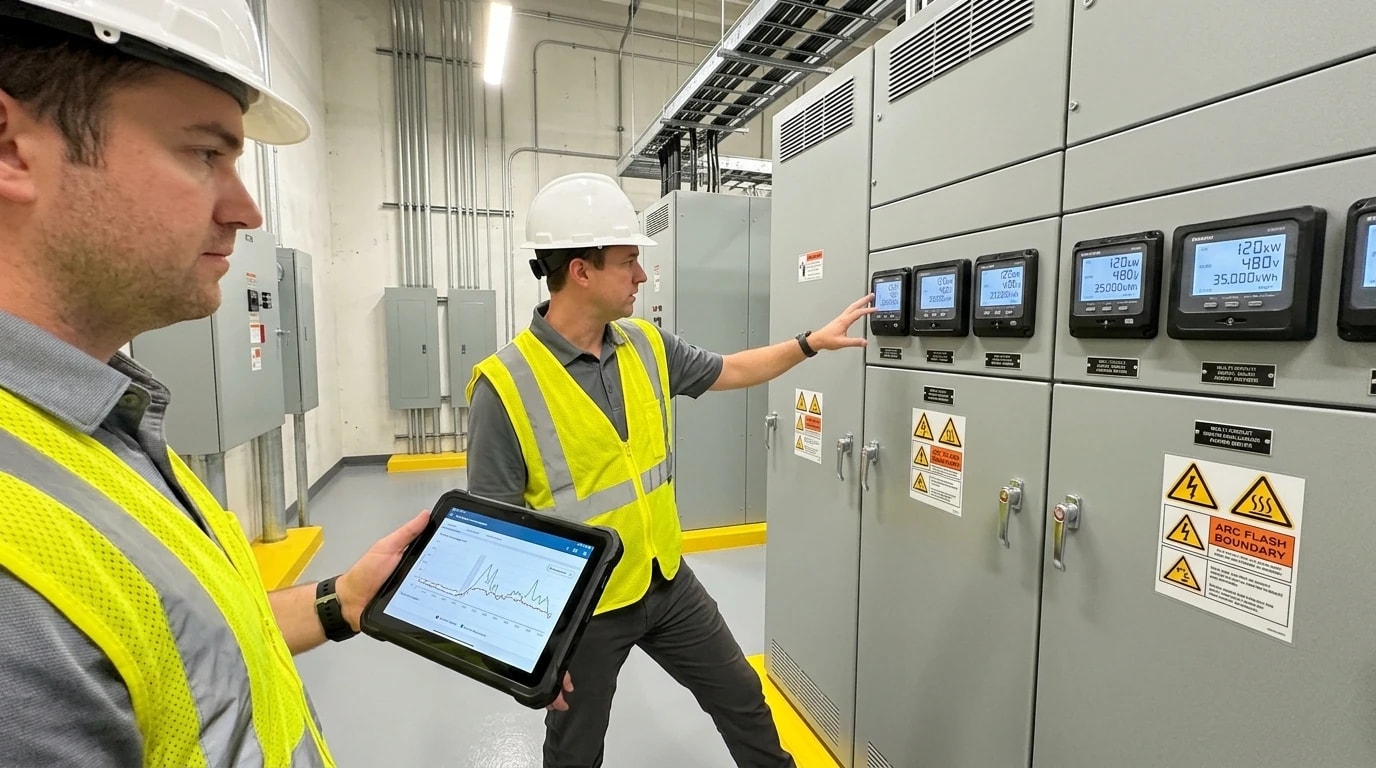
Once energy flows are mapped and phantom loads are identified, engineers must build mathematical models to measure ongoing performance. The ISO 50006:2023 standard outlines the principles and guidelines for establishing energy baselines (EnBs) and energy performance indicators (EnPIs). These metrics are vital for isolating localised energy hotspots from normal operational variations.
Constructing a Mathematical Energy Baseline
To determine whether an energy-reduction project has delivered genuine savings, engineers must compare post-implementation consumption against a scientifically valid baseline. ISO 50006:2023 advises against using simple historical averages, as they fail to account for variable factors like production throughput, ambient weather conditions, or product mix changes.
Instead, engineers use linear or multi-variable regression analysis to define the relationship between energy consumption (E) and relevant variables. The standard regression equation is expressed as:
E=β0+β1⋅P+∑(βi⋅Xi)+eWhere:
- E represents the calculated or predicted energy consumption during a specified time interval (expressed in kWh, MJ, or m3).
- P represents the primary production output metric, such as tonnes of product, number of batches, or thousands of units produced.
- Xi represents independent static or relevant variables, such as Heating Degree Days (HDD) for gas-fired space heating, or ambient humidity levels for chiller performance.
- β0 is the intercept coefficient on the y-axis, representing the constant baseload energy consumption (the phantom load) when production is zero.
- βi represents the regression coefficients that quantify the sensitivity of energy consumption to changes in each respective variable.
- e is the residual error, representing the difference between the actual observed consumption and the value predicted by the model.
By calculating β0, engineers can mathematically isolate the exact volume of energy that is entirely decoupled from manufacturing activity. A high β0 value relative to total energy use indicates a plant with substantial structural waste, identifying it as an immediate candidate for hotspot remediation.
Tracking Production-Linked Energy Performance Indicators (EnPIs)
With a robust energy baseline in place, facility managers can define dynamic Energy Performance Indicators (EnPIs) that adjust automatically based on production volume. Static metrics, such as "total kWh per month", are often misleading. For example, if production drops by 50% due to market conditions, total energy consumption will decrease, yet the plant's specific energy consumption (kWh per tonne of product) will rise because the fixed baseload (β0) is distributed over fewer units.
By applying ISO 50006:2023 principles, engineers can track the ratio of actual energy consumed to the target energy predicted by the regression model. This ratio, known as the Energy Performance Indicator, allows operators to detect subtle efficiency declines instantly. If the EnPI ratio rises above 1.0, it indicates that a process is consuming more energy than the baseline model predicted for that specific production rate and ambient temperature, flagging a localised energy hotspot.
Multi-Utility Data Acquisition and Connectivity Architecture
To feed these mathematical baseline models with accurate data, factories must establish a continuous, high-resolution data acquisition framework. This involves interfacing directly with existing field instrumentation and automation systems across multiple utility networks.
Non-Invasive PLC Integration and Protocol Selection
Modern manufacturing facilities contain a wealth of untapped energy data locked inside Programmable Logic Controllers (PLCs), motor drives, and standalone sub-meters. Accessing this data does not require invasive, high-risk plant shutdowns or rewiring. Instead, deployment teams utilise secure, non-invasive connectivity methods to poll existing PLC registers and hardware.
The integration architecture supports standard industrial protocols to communicate with various devices:
- Modbus TCP/RTU: Widely used for polling electrical sub-meters, gas thermal mass flow meters, and steam vortex flow meters.
- OPC-UA: Selected for secure, object-oriented data retrieval from modern PLC platforms (such as Siemens S7 or Rockwell ControlLogix) without altering running control code.
- BACnet/IP: Employed primarily for interfacing with building management systems (BMS) that control factory HVAC, chillers, and boiler plant auxiliary loops.
- MQTT: Utilised as a lightweight, publish-subscribe protocol ideal for transmitting low-bandwidth data from remote edge sensors or IoT-enabled flow and pressure transmitters.
Secure, Read-Only One-Way Cloud Architecture
Industrial cybersecurity is paramount, particularly in highly regulated sectors like pharmaceuticals (where Good Manufacturing Practice, or GMP, is mandated) and food and beverage (which must adhere to strict HACCP standards). To maintain absolute operational integrity, the communication gateway must be physically incapable of sending commands back into the plant network.
The data acquisition architecture employs a strict, read-only one-way cloud push methodology. This is enforced through hardware configuration and firewall rules that block all inbound traffic from the external internet to the plant floor. The local gateway initiates an encrypted outbound connection (typically using TLS 1.3) to push raw utility data up to the cloud analytics engine. By maintaining zero-write access to plant systems, this design ensures that the energy monitoring platform cannot interfere with safety-critical control loops, chemical batch recipes, or product quality parameters.
Six Utility Stream Mapping: Gas, Steam, and Beyond
While electricity monitoring is crucial, focusing solely on power consumption ignores major thermal energy drains. Complete energy hotspot identification requires the simultaneous monitoring of six core utility streams:
- Electricity: Tracking active power (kW), reactive power (kVAR), power factor, and voltage harmonics at the main incomer and major distribution boards.
- Natural Gas: Monitoring fuel feed rates to boilers, direct-fired ovens, and thermal oxidisers.
- Process Water: Measuring intake volume, cooling loop circulation rates, and wastewater discharge rates to detect hidden pipe breaks or valve bypasses.
- Steam: Tracking mass flow rates (kg/h), steam pressure, and temperature to calculate total enthalpy delivery and detect boiler efficiency drops.
- Compressed Air: Measuring volumetric flow (m3/min), system pressure (bar), and compressor power consumption to monitor specific efficiency (kW/m3/min).
- Fuel Oil: Monitoring consumption levels in standby generators, localised backup boilers, or high-temperature thermal fluid heaters.

Track energy consumption, emissions, and process parameters with seamless PLC/SCADA integration via Modbus, OPC-UA, and MQTT protocols.
The Omni Vision Energy Intelligence Platform in Action
EnerTherm Engineering’s Omni Vision Energy Intelligence Platform translates these high-volume, multi-utility data streams into actionable operational intelligence. This turnkey solution integrates precision physical instrumentation with EPSA’s cloud-based AI analytics engine, enabling factories to transition from manual spreadsheets to centralised, automated energy management.
Hardware and EPSA Cloud AI Integration
The Omni Vision deployment begins with the installation of non-invasive sensors, clamp-on ultrasonic flow meters, and smart gateway hardware. This hardware aggregates the physical measurements from the six utility streams and securely transmits them to EPSA’s cloud intelligence platform.
Once in the cloud, the raw data is cleaned, aligned with timezone and production calendars, and ingested by specialised machine learning models. These models are trained specifically on industrial thermal and electrical system behaviours. This cloud-based approach allows the platform to perform intensive statistical calculations and pattern-matching without consuming the local facility’s computing resources or impacting control room workstation performance.
AI-Driven Anomaly Detection and Predictive Analytics
A key feature of the Omni Vision platform is its 24/7 AI-driven anomaly detection. Instead of relying on simple static alarm thresholds (which frequently trigger false positives during normal production transitions), the platform utilises dynamic machine learning models. These models establish a multi-dimensional baseline of normal operating behaviour for every monitored asset.
If a compressed air compressor begins to short-cycle, or a steam valve starts to hunt (modulate excessively), the AI engine detects the anomaly immediately. The system alerts facility engineers to the exact equipment ID and describes the nature of the deviation.
Furthermore, the platform applies predictive forecasting to estimate future utility demands. By combining historical production schedules, weather forecasts, and machine health data, Omni Vision projects peak demand days in advance. This allows engineers to reschedule energy-intensive processes (such as furnace heat-ups or high-volume CIP washes) to off-peak hours, avoiding expensive utility peak-demand tariffs.
Project Execution: The 8-to-16-Week Turnkey Deployment
Implementing an enterprise-wide energy intelligence system can often seem daunting. EnerTherm Engineering addresses this challenge by executing a standardised, highly structured 8-to-16-week turnkey deployment model:
This rapid, phased approach minimises internal resource requirements for the site team and ensures that actionable hotspot data is delivered quickly, typically initiating energy savings in under four months from project kick-off.
Capital Expenditure Justification and the IETF Framework

Identifying an energy hotspot is only the first step; rectifying it often requires capital investment, such as replacing a legacy boiler, retrofitting variable speed drives, or installing a high-efficiency heat recovery system. To secure approval for these capital projects, energy engineers must construct a highly robust, auditable business case.
Structuring an Investment Case using IETF Guidance
The UK government's Industrial Energy Transformation Fund (IETF) provides an excellent, rigorous framework for justifying capital investments through verified energy savings. Managed by the Department for Energy Security and Net Zero (DESNZ), the IETF is designed to help high-energy-use businesses reduce their energy consumption and carbon emissions.
To align with IETF best practices and qualify for funding support, an investment proposal must prove that the requested capital will be directly responsible for the projected energy savings. This requires constructing a "reference case".
The reference case represents a standard, like-for-like replacement of the existing equipment that would simply maintain production capacity without delivering energy efficiency benefits. By comparing the capital cost of the high-efficiency solution against the baseline reference case cost, engineers can isolate the "eligible energy efficiency cost".
The Omni Vision platform provides the high-fidelity, production-linked data required to calculate this reference case. It links utility consumption directly to production output (e.g., measuring precisely how many kWh are consumed per tonne of output on a specific production line), allowing engineers to present an investment case that is backed by real operational performance data, rather than theoretical manufacturer datasheets.
Measurement & Verification for Sub-12-Month ROI
To guarantee investment returns and satisfy corporate finance directors, energy reduction projects must undergo rigorous Measurement & Verification (M&V). Omni Vision automates this process by adhering to the International Performance Measurement and Verification Protocol (IPMVP) standards.
By utilising the post-project verification data, the platform tracks actual energy consumption against the pre-retrofit baseline model. The system automatically subtracts the influence of independent variables (such as ambient temperature changes or fluctuations in production volume) to isolate the exact energy and financial savings delivered by the project. This precise, transparent M&V process consistently proves the ROI of Omni Vision deployments, which regularly deliver 15% to 25% overall energy cost reductions, yielding a full project payback in less than 12 months.
Streamlining Regulatory Compliance and Carbon Reporting
In addition to driving direct financial savings, identifying and eliminating energy hotspots is essential for complying with increasingly stringent environmental regulations and corporate sustainability mandates.
Automated Scope 1 and Scope 2 Emissions Calculations
Manual carbon accounting is slow and prone to human error. The Omni Vision platform automates this process by continuously translating raw energy consumption data into localised carbon dioxide equivalent (CO2e) emissions.
The platform automatically applies the correct, up-to-date regional emission factors to each utility stream:
- Scope 1 (Direct Emissions): Calculated in real-time from the consumption of natural gas, fuel oil, or process fuels used in on-site boilers, furnaces, and CHP plants.
- Scope 2 (Indirect Emissions): Derived from purchased grid electricity and imported steam, dynamically adjusting for grid carbon intensity fluctuations throughout the day.
By automating these calculations at the asset, line, and facility levels, the platform provides real-time visibility into the carbon footprint of individual production batches (e.g., calculating the precise kgCO2e emitted per batch of chemicals or food products).
Audit-Ready Reporting for SECR, ESOS, and ISO 50001
The granular data collected by the platform is structured to be completely audit-ready, satisfying the compliance requirements of major regulatory frameworks:
- SECR (Streamlined Energy and Carbon Reporting): Provides the mandatory UK corporate reporting data, including annual energy use, greenhouse gas emissions, and an intensity ratio (such as emissions per unit of turnover).
- ESOS (Energy Savings Opportunity Scheme): Generates the detailed, high-resolution profile data required for UK Phase 4 compliance audits, highlighting proven energy-saving opportunities.
- ISO 50001 (Energy Management Systems): Serves as the continuous monitoring and data collection engine required to maintain certification, tracking EnPIs and demonstrating continual energy performance improvement.
- EU ETS (European Union Emissions Trading System): Delivers highly accurate, verifiable fuel consumption data for heavy industrial facilities subject to carbon cap-and-trade regulations.
By combining precision hardware integration, secure read-only cloud connectivity, and advanced AI analytics, the Omni Vision platform allows industrial manufacturing facilities to translate complex raw utility data into continuous energy savings through automated insights, satisfying both financial and environmental objectives.
This article reflects the independent analysis and editorial opinion of EnerTherm Engineering. Product names, trademarks, and brands mentioned belong to their respective owners. EnerTherm Engineering is not affiliated with, endorsed by, or a licensee of any third-party software or product mentioned unless explicitly stated.

Technical Manager — EnerTherm Engineering
John Naranjo is Technical Manager at EnerTherm Engineering, bringing specialist expertise in chemical and environmental engineering. He recently led the implementation of Omni Vision, EnerTherm's real-time energy and utility monitoring platform. He holds an MSc in Environmental Engineering from the University of Huelva and a BSc in Chemical Engineering, with memberships in both the Energy Institute and IChemE.
