Pinch Analysis Cuts Process Energy Demands by 15-30%
Applying heat exchanger network design to meet ESOS requirements in chemical plants.
Pinch Analysis is a thermodynamic methodology that optimises heat exchanger networks to minimise energy consumption and reduce utility demands in industrial processes.
Energy costs remain high, forcing chemical plants, pharmaceutical manufacturers, and oil refineries to scrutinise their utility bills. With the UK Government enforcing strict carbon reduction pathways, businesses must find practical methods to lower energy consumption. Thermal energy is often the largest single operational cost in manufacturing. Industrial processes frequently consume significant amounts of fuel for heating while simultaneously rejecting massive quantities of waste heat to the atmosphere or cooling towers. This simultaneous demand for heating and cooling points to a structural inefficiency that process engineers can systematically resolve. By analysing process integration through thermodynamic limits, facilities can routinely achieve a 15 to 30 per cent reduction in primary thermal energy consumption.
Thermodynamic Foundations of Pinch Analysis

Pinch Analysis is based on the first and second laws of thermodynamics. It operates on the premise that a process can be mathematically and graphically represented to show its absolute minimum energy target before any physical equipment is designed. Bodo Linnhoff and John Flower developed the foundational pinch principles in the late 1970s at the University of Leeds and Imperial Chemical Industries (ICI). This work challenged conventional, iterative heat exchanger design methods by introducing a systematic, thermodynamic framework.
Composite Curves and the Heat Cascade
To perform a Pinch Analysis, engineers must first identify all hot streams (streams that require cooling) and cold streams (streams that require heating) within the process boundary. For each stream, four critical parameters are extracted: the supply temperature, the target temperature, the mass flow rate, and the specific heat capacity. These parameters define the heat capacity flow rate (CP) and the total enthalpy change (ΔH) of each stream.
Once these properties are defined, individual streams are combined to create hot and cold composite curves. The hot composite curve represents the total heat available in the process across various temperature ranges, while the cold composite curve represents the total heat required.
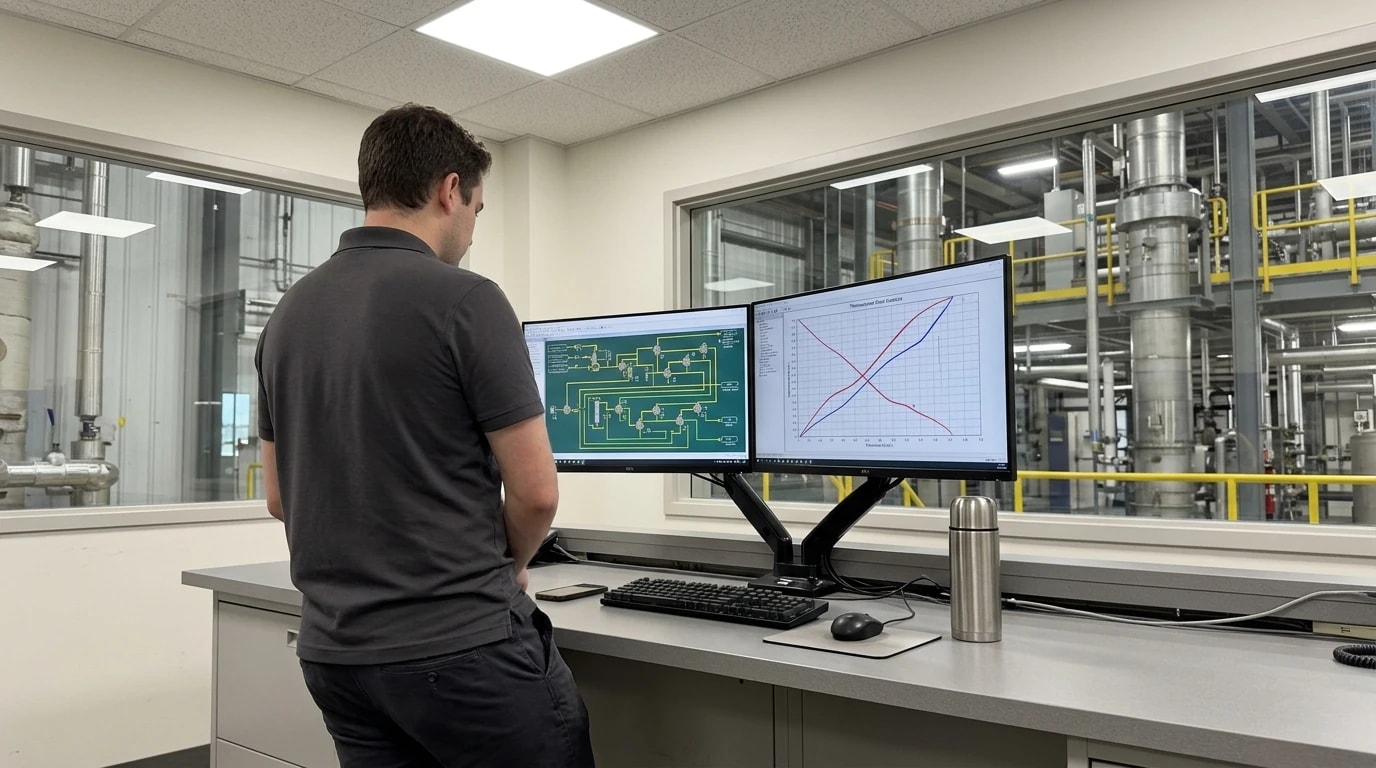
Plotting these curves on a Temperature-Enthalpy (T−H) diagram reveals the thermal interaction of the system. The vertical distance between the two curves represents the temperature driving force (ΔT). By shifting the curves horizontally relative to each other, engineers can adjust the minimum temperature approach (ΔTmin). This parameter represents the minimum allowable temperature difference inside any heat exchanger in the network.
Identifying the Pinch Temperature Bottleneck
The point where the hot and cold composite curves come closest to each other is known as the pinch point, or the pinch temperature. The pinch point represents a thermodynamic bottleneck where the temperature driving force is at its minimum (ΔTmin).
The pinch divides the process into two distinct thermodynamic regions:
- The region above the pinch temperature, which is a heat sink and requires only external heating utility.
- The region below the pinch temperature, which is a heat source and requires only external cooling utility.
By using the "Problem Table Algorithm", a numerical method developed by Linnhoff, engineers can calculate the precise energy targets of the process without relying on graphical plots. The algorithm structures the process into temperature intervals, calculates the heat balance within each interval, and cascades the heat surplus down through the intervals. The point in the cascade where the heat flow falls to zero identifies the exact location of the pinch point.

Map every energy and material flow in your process with detailed heat and mass balance calculations — the foundation for any optimisation or design project.
The Three Fundamental Rules of Pinch Design
The central benefit of identifying the pinch point is that it establishes strict design criteria. Process integration handbooks dictate three golden rules that engineers must follow to design a heat exchanger network that achieves the target minimum utility consumption. Violating any of these rules introduces avoidable thermodynamic inefficiencies, resulting in simultaneous, unnecessary utility use.
No External Heat Below the Pinch
Below the pinch point, the process is a net heat source. The system has a surplus of energy that must be rejected to cold utilities, such as cooling water or ambient air. Introducing external hot utilities, such as steam or hot oil, to streams below the pinch is thermodynamically wasteful. Any heat added from an external source below the pinch must ultimately be rejected by the cold utility system. This results in a double penalty: the plant pays for unnecessary heating utility and then pays again for the cooling utility required to remove it.
No External Cooling Above the Pinch
Above the pinch point, the process acts as a net heat sink. The system requires additional energy to reach its final target temperatures. Introducing external cold utilities above the pinch removes heat that could otherwise be recovered by cold streams. This heat removal forces the system to consume an equivalent amount of external hot utility to make up for the deficit. Just like the previous rule, violating this principle creates a double utility penalty.
No Heat Transfer Across the Pinch Point
The most common design error in unoptimised heat recovery networks is transferring heat from a hot stream above the pinch to a cold stream below the pinch. The pinch point acts as a thermodynamic barrier. If heat flows across the pinch, the heat sink above the pinch loses energy, which must be replaced by additional hot utility. Concurrently, the heat source below the pinch receives unwanted energy, which must be removed by additional cold utility.
This relationship is defined by a simple heat balance equation:
QH=QH,min+α QC=QC,min+αwhere:
- QH is the actual hot utility consumption of the process.
- QH,min is the minimum hot utility target calculated by Pinch Analysis.
- QC is the actual cold utility consumption of the process.
- QC,min is the minimum cold utility target.
- α is the amount of heat transferred across the pinch point.
The equation shows that for every kilowatt of heat that crosses the pinch point (α), the process requires an additional kilowatt of hot utility and an additional kilowatt of cold utility. Eliminating cross-pinch heat transfer is the primary method for cutting process energy demands by 15 to 30 per cent.
Heat Exchanger Network Optimisation (HEN)
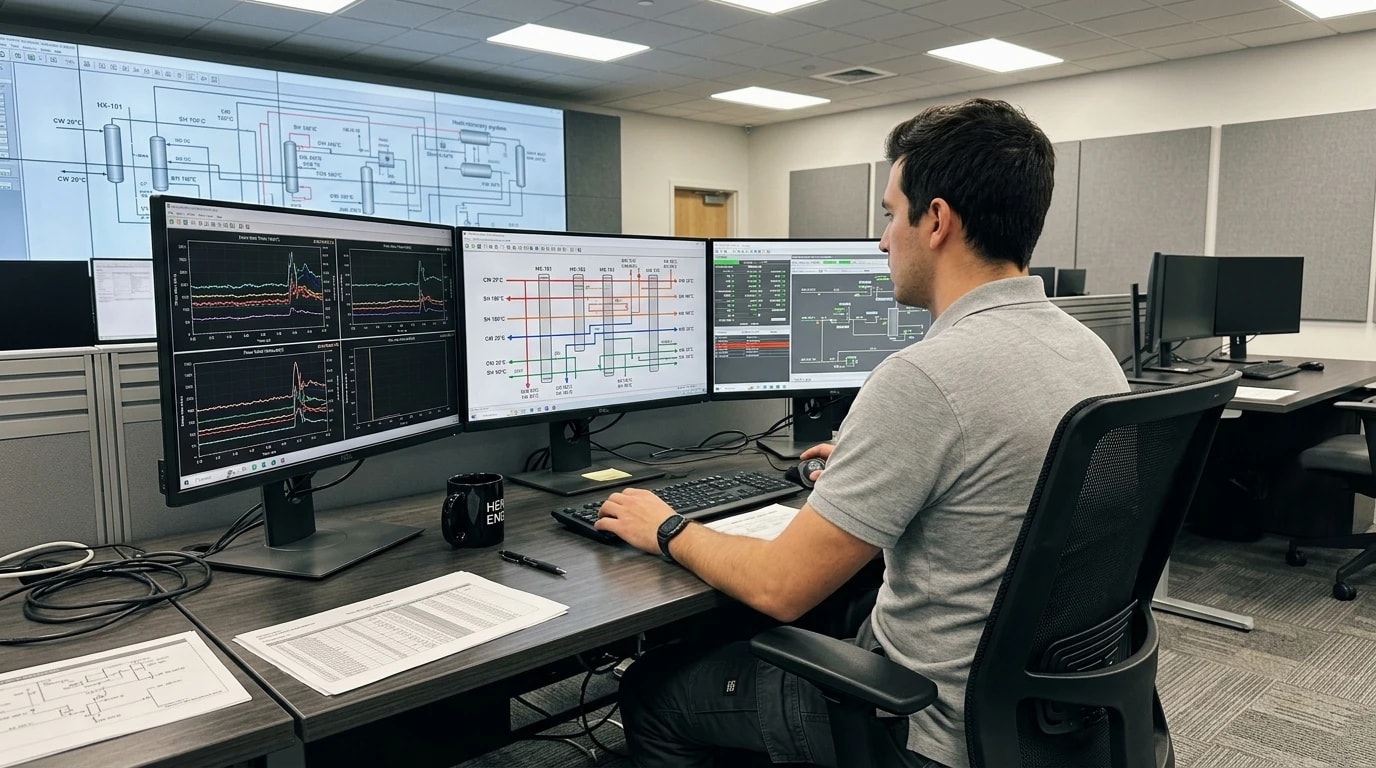
Achieving the targeted energy savings requires systematic Heat Exchanger Network (HEN) optimisation. The goal of HEN design is to match hot and cold process streams in a way that maximises internal heat recovery while staying within practical operating constraints.
Designing the Optimal Network Synthesis
The design of a heat exchanger network is typically performed using a grid diagram, which is a schematic representation where streams are drawn as horizontal lines. Hot streams flow from left to right (high to low temperature), and cold streams flow from right to left (low to high temperature). Heat exchangers are shown as vertical lines connecting circles on the matched streams.
Engineers start the design at the pinch point and work outwards. This is because the design is most constrained at the pinch, where the temperature driving force is smallest. To ensure a feasible heat transfer, the following stream parameters must match at the pinch:
- For matches above the pinch: The heat capacity flow rate of the hot stream (CPH) must be less than or equal to the heat capacity flow rate of the cold stream (CPC). Mathematically, this is expressed as CPH≤CPC. This ensures that the temperature difference between the streams increases as they move away from the pinch.
- For matches below the pinch: The heat capacity flow rate of the hot stream must be greater than or equal to that of the cold stream (CPH≥CPC).
If these criteria are not met, the temperature profiles will cross, violating the second law of thermodynamics. In such cases, stream splitting is required to adjust the CP values of individual branches.
Balancing Capital Cost and Energy Savings
Optimising a heat exchanger network involves a trade-off between operating costs (energy) and capital costs (equipment area). A small minimum temperature approach (ΔTmin) reduces utility requirements because the hot and cold composite curves are closer together. However, a small ΔTmin also reduces the temperature driving force inside the heat exchangers, requiring larger heat transfer areas and increasing capital expenditure.
Conversely, a large ΔTmin increases the temperature driving force, reducing the required heat exchanger area and capital costs. However, it also increases the gap between the composite curves, raising the demands for external hot and cold utilities.
Process integration teams perform "super-targeting" to identify the optimum value of ΔTmin. This method calculates the total annualised cost (the sum of annualised capital costs and annual utility costs) across a range of ΔTmin values. The resulting curve typically exhibits a distinct minimum, which identifies the economic optimum for the specific facility.
Solving Threshold Problems in Practice
In some industrial processes, the hot utility or cold utility target can fall to zero at a certain value of ΔTmin. This behaviour is known as a threshold problem.
In a threshold problem, the process only requires one type of utility (either heating or cooling) over a wide range of operating conditions. For example, a highly exothermic reactor system might produce so much excess heat that, with proper heat integration, it requires no external heating utility. When analysing a threshold system, increasing the heat exchanger area beyond a specific threshold limit does not yield further energy savings. Identifying these threshold limits prevents companies from over-designing heat recovery networks and spending capital on unnecessary heat exchangers.
Industrial Applications and Sector-Specific Challenges
Pinch Analysis is highly versatile, but its practical implementation must be tailored to the specific operational constraints of each sector. Implementing process integration in a continuous oil refinery is very different from managing heat recovery in a batch pharmaceutical facility.
Energy Conservation in Industrial Processes for Chemicals
Chemical plants represent some of the most energy-intensive manufacturing operations. These facilities use large volumes of steam for distillation, evaporation, and reactor heating, while simultaneously requiring cooling water for product condensation and exothermic reaction control.
In chemical plants, Pinch Analysis is often used to integrate distillation columns with the background process. Standard chemical engineering handbooks note that a distillation column should ideally not run across the pinch temperature. Running a column across the pinch means the reboiler consumes heat above the pinch, while the condenser rejects heat below the pinch. If the column can be shifted entirely above or entirely below the pinch, its utility demands can be integrated with the rest of the process, reducing the plant's overall energy load.
Another common application is optimising industrial process heater efficiency. By recovering heat from hot reactor effluents to preheat cold feed streams, plants can reduce the thermal load on primary gas-fired heaters. This direct reduction in fuel gas consumption decreases operating costs and cuts carbon dioxide emissions.
Thermal Energy Management in Pharmaceuticals
Pharmaceutical manufacturing relies heavily on batch processes, which present unique challenges for thermal energy management. Unlike continuous chemical processes, batch streams are time-dependent. A hot stream may only be available during a specific reaction step, while a cold stream may require heating hours later.
To address this time constraint, engineers use time-dependent Pinch Analysis. This method maps stream availability not only across temperature intervals but also across time intervals. There are two primary ways to resolve time mismatches in batch operations:
- Heat Storage Systems: Using thermal energy storage, such as pressurised hot water tanks or phase-change materials, to store heat recovered from a batch step and release it when a cold stream is active.
- Schedule Optimisation: Shifting the start times of specific batch operations to maximise the overlap between hot and cold streams, enabling direct heat exchange without thermal storage.
Additionally, pharmaceutical plants must comply with strict Good Manufacturing Practices (GMP). Heat recovery systems must be designed to eliminate the risk of cross-contamination. Engineers typically use double-wall heat exchangers or intermediate heat transfer loops to ensure that utility streams cannot contaminate active pharmaceutical ingredients (APIs).
Multi-Zone Thermal Profiling in Food Manufacturing
The food and beverage sector consumes substantial energy for pasteurisation, sterilisation, drying, and concentration. These processes operate at relatively low temperatures (typically between 60°C and 140°C), making them ideal candidates for low-grade waste heat recovery systems.
To optimise these systems, engineers perform multi-zone thermal profiling. This process maps the precise heating and cooling demands across different areas of the plant, such as the brewhouse in a brewery or the spray dryer in a dairy plant. In spray drying, for example, the high-temperature exhaust air contains significant latent and sensible heat. By using a run-around coil system, this heat can be recovered to preheat the incoming fresh air, reducing the steam demand of the air heater.

Map every energy and material flow in your process with detailed heat and mass balance calculations — the foundation for any optimisation or design project.
Data-Driven Modelling and Simulation
A successful Pinch Analysis depends entirely on the quality of the underlying mass and energy balances. Erroneous stream data leads to incorrect composite curves, which can result in poorly sized heat exchangers and missed energy targets.
The Heat and Mass Balance Engineering Methodology
To ensure accuracy, thermal engineering projects rely on a structured, data-driven methodology. This framework standardises the transition from initial raw site data to a fully validated simulation model. The process begins with comprehensive data acquisition, where engineers collect piping and instrumentation diagrams (P&IDs), historical operational logs, and real-time sensor measurements.
The collected data is then used to construct rigorous Heat and Mass Balance (HMB) models. Process engineers typically use industry-standard simulation platforms such as Aspen Plus, HYSYS, or open-source software like DWSIM to simulate complex process systems. These tools use thermodynamic equations of state (such as Peng-Robinson or NRTL) to accurately predict physical properties, phase behaviour, and enthalpy changes of multi-component streams.
Creating the Single Source of Truth
The final output of this modelling process is a single-source-of-truth Process Flow Diagram (PFD) with embedded stream tables. This PFD provides a clear, validated record of every stream’s temperature, pressure, flow rate, and composition.
To make the thermodynamic data more accessible to plant managers and financial decision-makers, engineers use Sankey energy mapping. A Sankey diagram represents energy flows through the process using proportional line widths. This visual tool immediately highlights where energy enters the plant, where it is lost through exhaust gas or cooling towers, and where opportunities for heat recovery exist. These validated models serve as the baseline for designing optimal heat exchanger networks and planning facility-wide utility upgrades.
Regulatory Compliance and Funding Frameworks in the UK
In the United Kingdom, energy efficiency is no longer just an operational preference; it is a regulatory requirement. The government has established clear mandates and funding mechanisms to push energy-intensive industries towards net-zero emissions.
UK Energy Savings Opportunity Scheme (ESOS) Phase 4
The Energy Savings Opportunity Scheme (ESOS) is the UK's mandatory quadrennial energy assessment regime for large organisations. It is administered by the Environment Agency under Statutory Instrument 2014/1643. ESOS applies to any large undertaking that employs 250 or more people, or has an annual turnover exceeding £44 million and a balance sheet total exceeding £38 million.
ESOS Phase 4 is currently underway, running from 6 December 2023 to 5 December 2027. Key aspects of Phase 4 include:
- Qualification Date: Organisations must determine if they are in scope based on their financial and employment status on 31 December 2026.
- Increased Energy Coverage: The threshold for audited energy consumption has been raised to at least 95 per cent of the organisation's total energy footprint (up from 90 per cent in Phase 3).
- Removal of Simpler Compliance Routes: Display Energy Certificates (DECs) and Green Deal Assessments (GDAs) are no longer accepted as valid routes to compliance.
- Mandatory Action Plans: Companies must formally report progress against the energy-saving action plans submitted during Phase 3.
For qualifying chemical and pharmaceutical plants, an ESOS audit must cover all significant industrial process energy use. A Pinch Analysis is widely regarded by energy auditors as the most rigorous way to satisfy the process auditing requirements of ESOS, converting a mandatory compliance exercise into a project that delivers real operational savings.
Industrial Energy Transformation Fund (IETF) Support
To help businesses implement the energy efficiency opportunities identified in ESOS audits, the UK Government created the Industrial Energy Transformation Fund (IETF). The IETF supports high-energy-use businesses to invest in energy efficiency and low-carbon technologies, helping them cut fuel bills and reduce carbon emissions.
The IETF launched in 2020 and operates in phases, with up to £500 million of funding available through 2028. Phase 3, launched in January 2024, provides up to £185 million in funding. The fund is designed for energy-intensive sectors, including:
- Chemical manufacturing
- Pharmaceutical production
- Food and drink processing
- Pulp and paper mills
- Refining and petrochemicals
The IETF provides capital grants to support feasibility studies, engineering studies, and the deployment of energy efficiency technologies. For instance, a chemical plant planning to redesign its heat exchanger network can apply for an IETF engineering study grant to fund the initial Pinch Analysis and detailed thermal design. Once the feasibility is proven, the company can apply for a deployment grant to cover up to 30 per cent of the capital costs required to purchase and install the new heat exchangers.
Summary Table of Pinch Analysis Benefits
The table below outlines how Pinch Analysis compares to traditional heat recovery methods across key engineering and financial metrics.
| Metric | Traditional Ad-Hoc Design | Pinch Analysis Process Integration |
|---|---|---|
| Energy Demand Reduction | Typically 5 to 10 per cent | Verified 15 to 30 per cent savings |
| Systematic Approach | Trial-and-error stream matching | Thermodynamic targeting before design |
| Capital Expenditure | Sub-optimal; often over-designed | Optimised trade-off (ΔTmin targeting) |
| Cross-Pinch Heat Transfer | Common; causes double utility penalty | Eliminated by strict design rules |
| Regulatory Alignment | Basic compliance | Satisfies ESOS Phase 4 audit mandates |
| Payback Period | Highly variable | Typically 6 months to 2 years |
Utilising these structured techniques allows manufacturers to transition away from localised, high-cost utility adjustments and move toward integrated thermal systems that significantly lower both fuel consumption and carbon emissions.
This article reflects the independent analysis and editorial opinion of EnerTherm Engineering. Product names, trademarks, and brands mentioned belong to their respective owners. EnerTherm Engineering is not affiliated with, endorsed by, or a licensee of any third-party software or product mentioned unless explicitly stated.

Managing Director — EnerTherm Engineering
Dr. François Pierrel is Managing Director of EnerTherm Engineering with over two decades of expertise in thermal design, heat transfer, and industrial energy optimisation. He holds a PhD in Heat Transfer from Cranfield University and a Post-Doctorate from Heriot-Watt University.
