How an Industrial Energy Efficiency Dashboard Saves 15-25%
How ATEX-certified IIoT integration automates ISO 50001 EnPIs and SECR reporting.
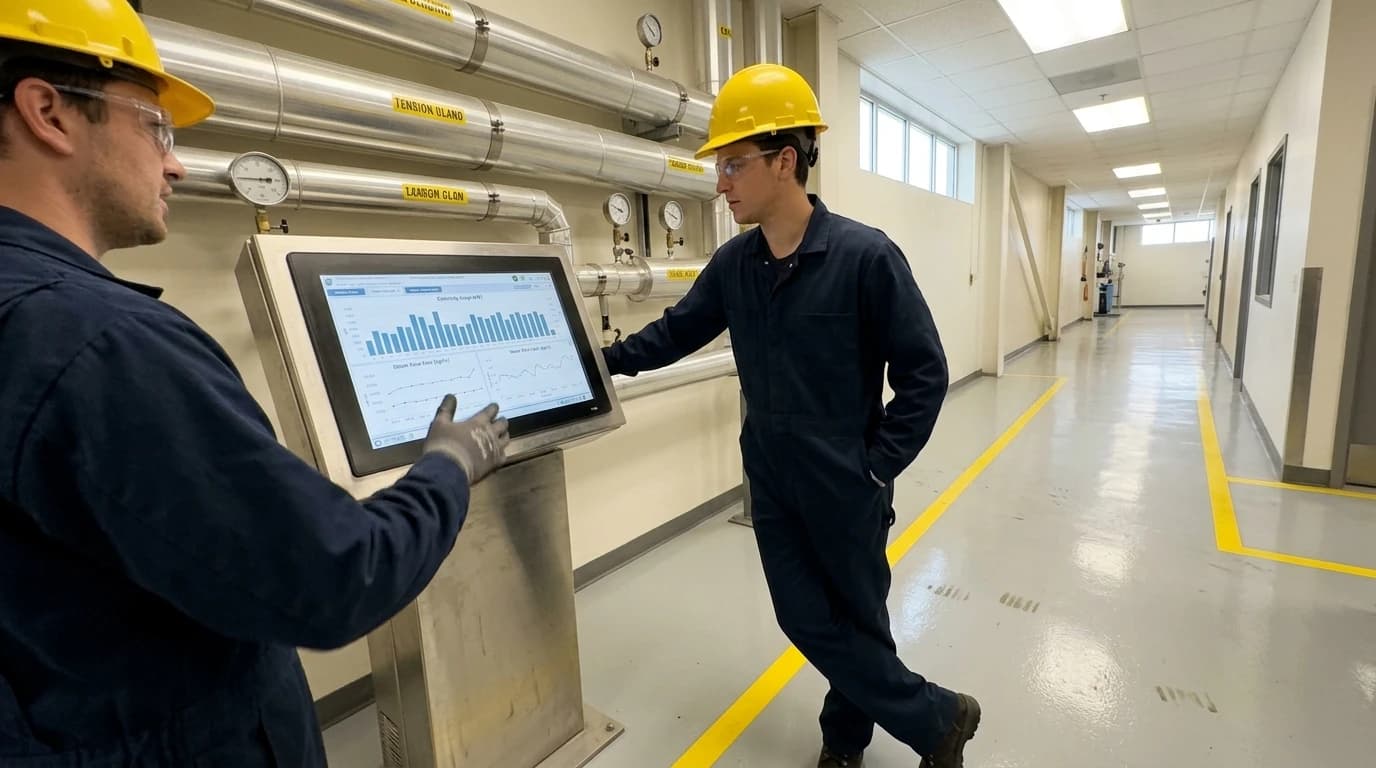
An industrial energy efficiency dashboard is an interactive software interface that aggregates, visualises, and analyses real-time utility consumption and production data to pinpoint operational waste and lower energy costs. In chemical processing plants, where utility bills represent the second-largest operational expense after raw materials, tracking these inputs is vital. Historically, plant operations relied on retrospective analysis, compiling manual meter readings and utility invoices weeks after consumption had occurred.
This delay makes it impossible to link energy spikes to specific batches, equipment failures, or process deviations. Transitioning to a centralised, automated dashboard allows chemical manufacturers to shift from reactive tracking to proactive energy management. By continuously mapping resource consumption to active production cycles, industrial facilities routinely achieve energy cost reductions of 15 to 25 per cent within the first twelve months of deployment.
Transitioning from Spreadsheets to an Industrial Energy Efficiency Dashboard
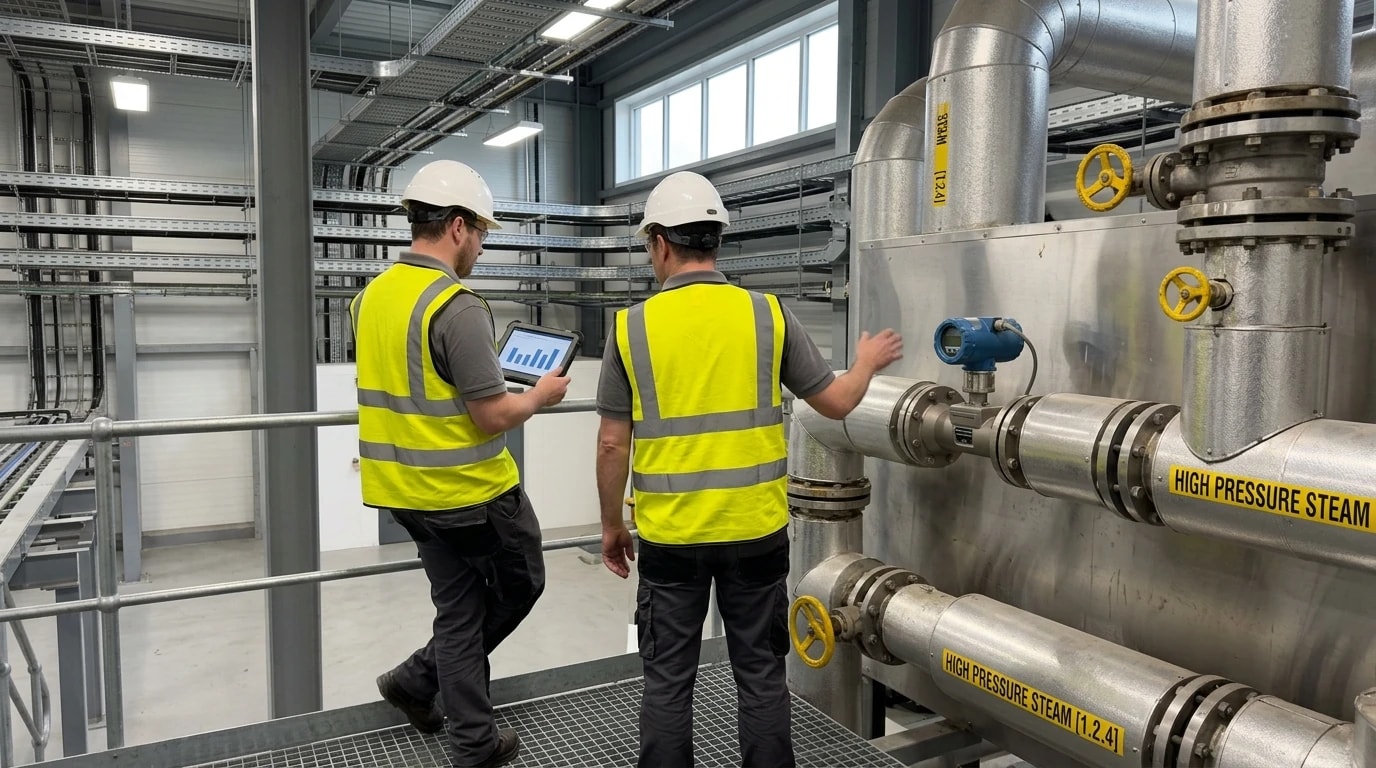
Many chemical plants still rely on spreadsheets to manage energy data. Although familiar, these static tools cannot support modern industrial energy management.
The Operational Limitations of Retrospective Manual Tracking
Manual tracking creates a minimum 30-day latency between energy consumption and management action. If a steam trap fails open on a distillation column, or a compressed air line leaks on a Friday evening, the issue remains invisible until the monthly utility invoice arrives.
Manual compilation is also highly susceptible to transcription errors that corrupt historical records. Being static, spreadsheets cannot correlate real-time power demand or gas usage with dynamic process variables, such as reactor temperatures, feed rates, or batch numbers. Consequently, plant managers cannot determine the true energy cost per tonne of specific chemical grades, leaving hidden waste unaddressed.
Automating Energy Baselines and Performance Indicators under ISO 50001:2018
The international standard for energy management, ISO 50001:2018, establishes a structured framework for industrial facilities to continuously improve energy performance. Compliance requires a documented Plan-Do-Check-Act cycle based on Energy Baselines (EnBs) and Energy Performance Indicators (EnPIs).
An industrial energy efficiency dashboard automates this process. Instead of manual calculations, the system continuously aggregates multi-stream utility data to define a dynamic baseline of plant operations. It automatically adjusts EnPIs to account for external variables, such as ambient temperature and raw material moisture content. This ensures that process teams can prove genuine, normalised efficiency improvements during external certification audits.
Integrating Physical Sensors in Hazardous Chemical Environments
Deploying digital solutions in chemical manufacturing requires strict adherence to safety standards, particularly when working in potentially explosive atmospheres.
Non-Invasive Instrumentation and ATEX Directive 2014/34/EU Compliance
Chemical production sites are divided into strict hazardous zones based on the presence of flammable gases, vapours, or dusts. Any electrical hardware deployed here must comply with the ATEX Directive 2014/34/EU to prevent ignition.
To satisfy these safety requirements, integrations utilise non-invasive, intrinsically safe instrumentation. Clamp-on ultrasonic thermal energy meters attach to the exterior of steam and chilled-water pipework without line cuts or process shutdowns. Similarly, split-core current transformers sit inside electrical distribution boards without disconnecting power cables. These non-invasive sensors maintain ATEX zone integrity, prevent sparking, and eliminate contamination or pressure drops.
Securing PLC Data Extraction via Industrial Protocols
Valuable utility and operational data already resides inside programmable logic controllers (PLCs) managing reactors, centrifuges, and boilers. An industrial energy efficiency dashboard extracts this telemetry by connecting to existing PLCs via industry-standard protocols like Modbus RTU, Modbus TCP, OPC UA, and MQTT Sparkplug B.
To ensure security, the architecture uses a hardware-level data gateway that establishes a strict one-way, outbound-only encrypted data flow to the cloud-based analytics engine. This physical separation guarantees zero-write access to active control systems. Active PLCs remain completely isolated from outside networks, securing critical chemical control loops against external interference.
Mapping Process-Level Utility Streams to Production Output
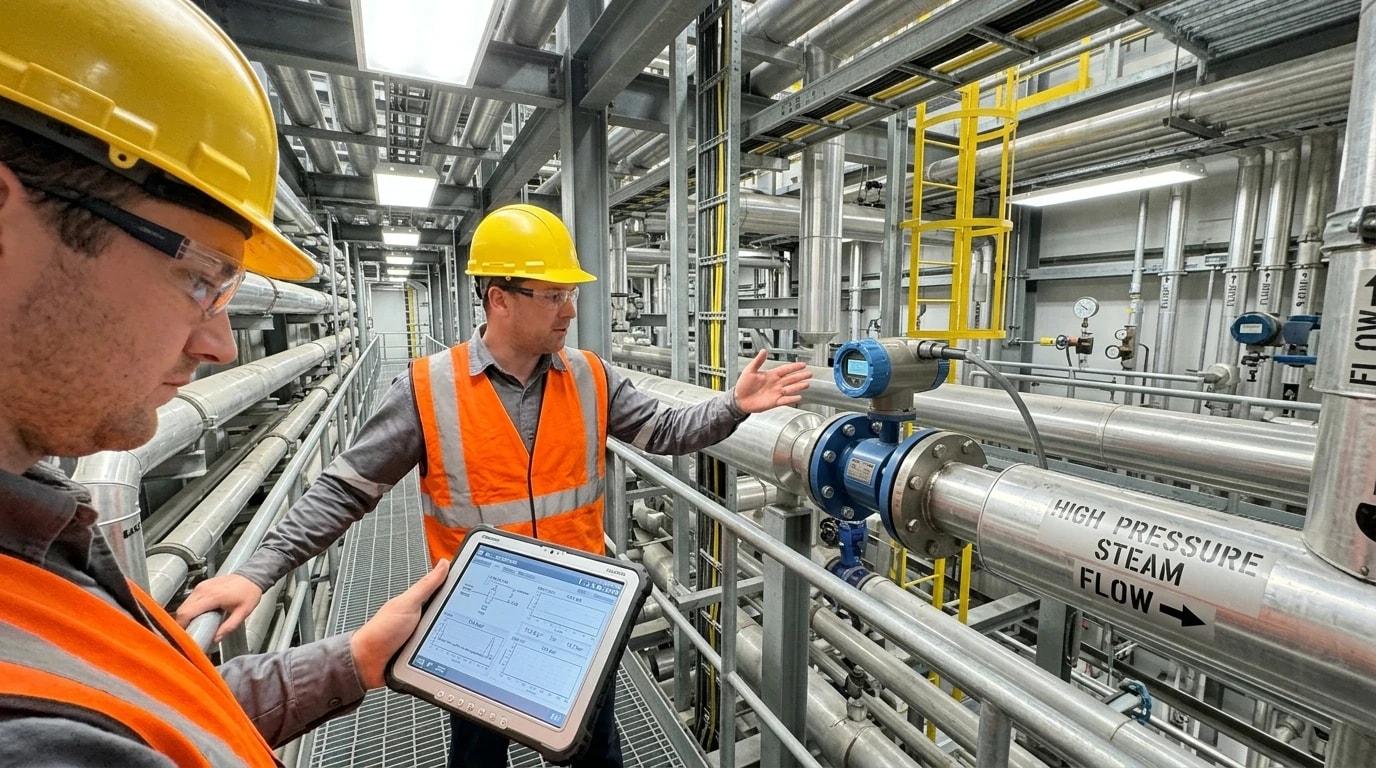
To unlock deep energy savings, an industrial energy efficiency dashboard matches utility consumption directly to active manufacturing schedules.
Real-Time Utility Cost Calculations for Distillation and Reactors
Chemical reactors and distillation columns are highly energy-intensive assets. To expose these costs, the dashboard dynamically calculates the financial footprint of every production batch. It combines electrical, steam, and thermal variables into a unified calculation:
Batch Energy Cost=(Pelec×T×Relec)+(Msteam×Δh×Rthermal)where:
- Pelec represents the average electrical power demand in kilowatts (kW) captured by the PLC submetering system.
- T represents the active batch run time in hours.
- Relec represents the real-time electrical tariff rate in pounds per kilowatt-hour (£/kWh).
- Msteam represents the total steam mass flow in kilograms (kg) delivered to the reactor or column.
- Δh represents the specific enthalpy difference of the steam across the heating loop in kilowatt-hours per kilogram (kWh/kg).
- Rthermal represents the unit cost of thermal energy in pounds per kilowatt-hour (£/kWh).
This formula runs automatically in the background, updating the dashboard with live costs so operators can immediately see the financial impact of their process settings.
From Raw Consumption to Specific Energy Consumption (SEC)
Evaluating a plant's performance based solely on absolute energy consumption can lead to false conclusions. If a facility increases its production volume, raw energy consumption rises naturally, yet the processes themselves may be operating more efficiently. Dashboards resolve this by calculating Specific Energy Consumption (SEC), an industry-standard metric expressed as kWh per tonne of finished product, which complies with ISO 50006:2023 guidelines.
| Process Asset | Physical Sensor Type | Primary PLC Protocol | Target KPI / EnPI |
|---|---|---|---|
| Distillation Reboiler | Clamp-on ultrasonic thermal energy meter | Modbus RTU / TCP | Specific Steam Consumption (kg steam per kg of distillate) |
| Reflux Pump | Split-core current transformer | OPC UA | Specific Electrical Consumption (kWh per tonne) |
| Chemical Reactor | Heat-flow thermal sensor / Mass flow meter | MQTT Sparkplug B | Specific Thermal Energy per Batch (kWh per batch) |
| Air Compressor | Non-invasive pressure & flow transmitter | Modbus TCP | Specific Energy Requirement (kW per m³/min) |
Normalising consumption data enables plant managers to compare the efficiency of different shifts, product formulations, and ambient conditions, highlighting the exact settings that result in the lowest energy consumption.
Quantifying the 15 to 25 Per Cent Savings: Where Inefficiencies Are Eliminated
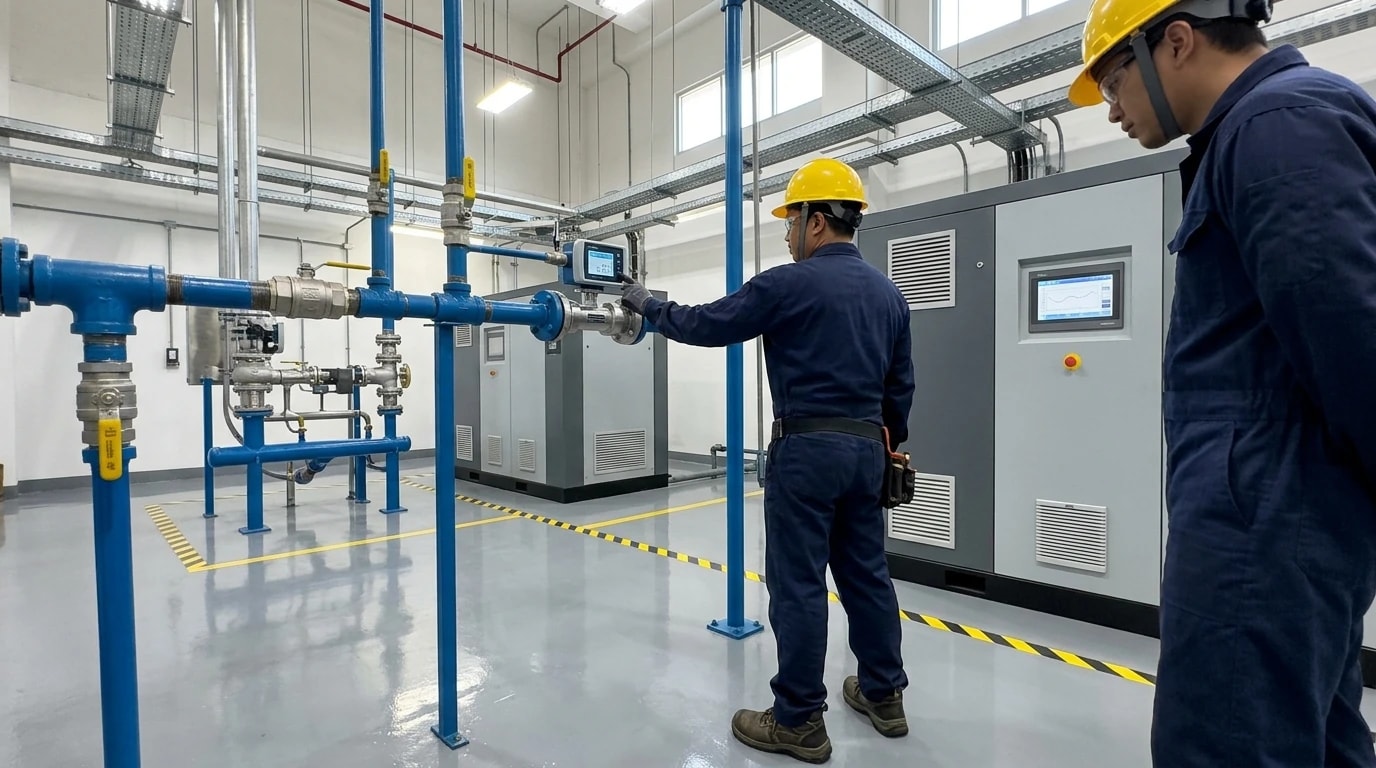
Real-time visibility through an industrial energy efficiency dashboard allows operations teams to target and eliminate major sources of waste that are invisible to manual tracking.
Eliminating Idle-State Utility Waste and Compressed Air Leaks
Much energy waste occurs when production lines sit idle between batches or during weekend closures. Compressed air is among the most expensive industrial utility streams, often representing 10 to 30 per cent of a plant's total electricity footprint. Assessments under ISO 11011:2013 reveal that leaks routinely waste 20 to 50 per cent of generated air volume.
An industrial energy efficiency dashboard monitors the Specific Energy Requirement (SER) of the compressed air system in kW per m³/min. During idle states, it tracks residual airflow. If this demand remains high, the dashboard flags a leak anomaly and alerts maintenance teams, who can then pinpoint and repair the leaks before the next shift starts.
Avoiding Peak Tariffs and Uncontrolled Thermal Spikes
UK grids penalise industrial users heavily during peak demand via DUoS (Distribution Use of System) red bands and Triad peak periods.
The dashboard processes real-time tariff structures and historical patterns to forecast daily electrical demand. If a plant is projected to exceed its agreed capacity threshold during a high-tariff window, the platform alerts the operations team. Managers can then temporarily shift non-critical, energy-heavy processes—such as raw material grinding or secondary blending—to lower-cost off-peak hours.
Additionally, the dashboard's AI-driven anomaly detection tracks reactor temperature profiles. By flagging minor heat-exchanger fouling or steam valve sticking early, the system alerts operators so they can prevent uncontrolled thermal spikes that would otherwise require excessive, costly chilled-water cooling loops to rectify.
Regulatory Compliance and Streamlined Reporting
Modern manufacturing operations face a complex web of environmental legislation. Managing compliance manually requires a substantial commitment of administrative time and resources.
Simplifying SECR and ESOS Audits with Automated Trails
Large UK firms must comply with the Streamlined Energy and Carbon Reporting (SECR) framework, which mandates annual disclosures of greenhouse gas emissions, energy use, and energy intensity ratios. Similarly, the Energy Savings Opportunity Scheme (ESOS) requires qualifying organisations to complete energy efficiency assessments every four years.
The dashboard acts as a continuous, tamper-proof repository for this utility data. Instead of spending weeks gathering paper invoices and estimating historical usage, compliance managers can generate verified, exportable reports instantly. These granular hourly logs simplify audits and reduce the administrative cost of regulatory compliance.
Scope 1 and Scope 2 Emissions Inventory Automation
To support decarbonisation, chemical plants must track direct emissions from on-site fuel combustion (Scope 1) and indirect emissions from purchased electricity and steam (Scope 2).
The platform integrates live utility data with official carbon conversion factors published by the UK Department for Energy Security and Net Zero (DESNZ). It automatically converts raw kWh of electricity and cubic metres of natural gas into carbon equivalent values, measured in tonnes of CO₂e.
These footprints correlate directly with live production schedules. The resulting real-time carbon intensity metric—such as kilograms of CO₂e per batch or per tonne of chemical produced—provides sustainability officers and directors with the exact data needed to guide operational decisions and verify progress towards net-zero targets.
This article reflects the independent analysis and editorial opinion of EnerTherm Engineering. Product names, trademarks, and brands mentioned belong to their respective owners. EnerTherm Engineering is not affiliated with, endorsed by, or a licensee of any third-party software or product mentioned unless explicitly stated.

Technical Manager — EnerTherm Engineering
John Naranjo is Technical Manager at EnerTherm Engineering, bringing specialist expertise in chemical and environmental engineering. He recently led the implementation of Omni Vision, EnerTherm's real-time energy and utility monitoring platform. He holds an MSc in Environmental Engineering from the University of Huelva and a BSc in Chemical Engineering, with memberships in both the Energy Institute and IChemE.
