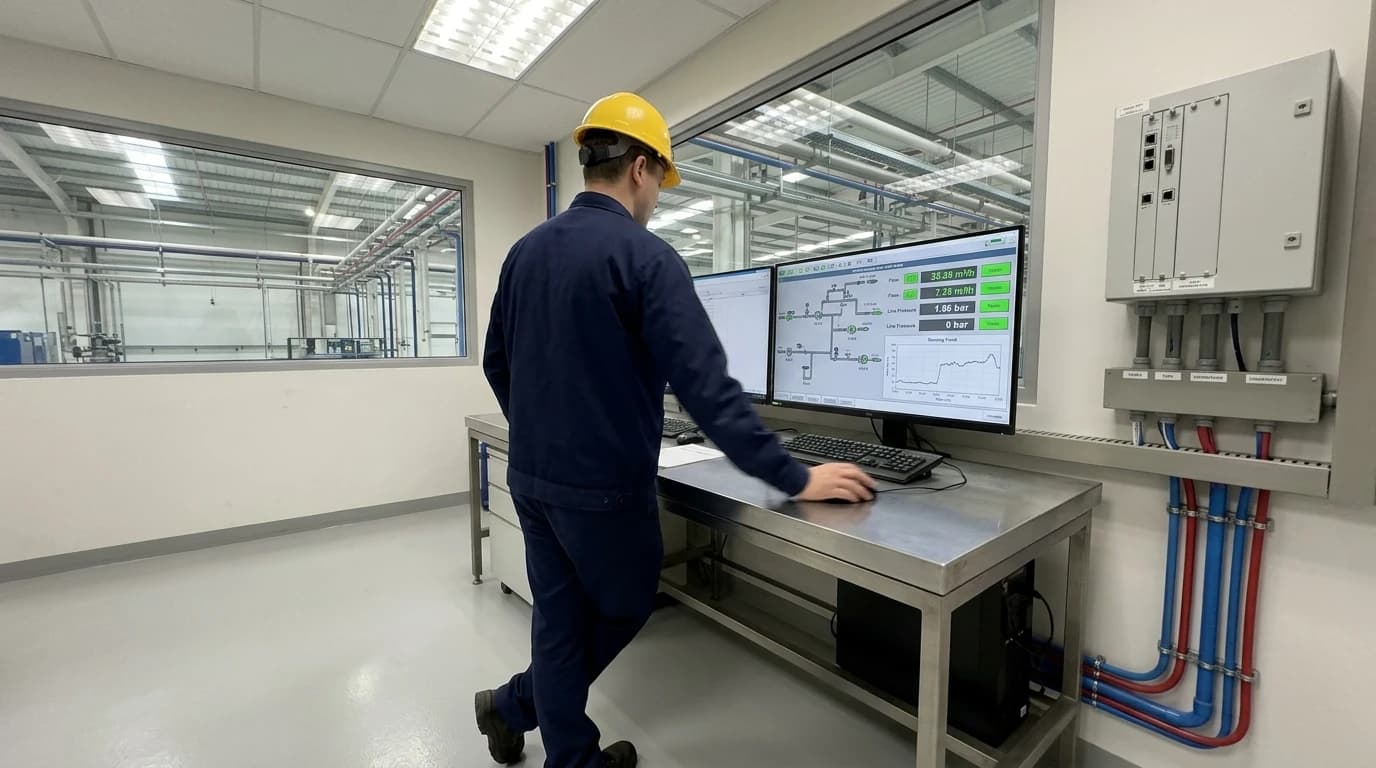
PLC Telemetry Cuts Compressed Air Waste by up to 30%
Using TwinCAT or TIA Portal to track idle-state flow and isolate system leaks.
Compressed air leak detection via PLC telemetry is an industrial utility monitoring methodology. It utilises programmable logic controllers (PLCs) and in-line instrumentation to continuously capture flow, temperature, and pressure parameters, automatically identifying line losses without manual inspection walks.
In manufacturing and process facilities, compressed air is frequently referred to as the "fourth utility" due to its cost and systemic distribution across complex production layouts. Generating compressed air is highly energy intensive, often accounting for 10 to 30 per cent of an industrial plant's total electrical consumption. However, up to 20 to 30 per cent of this generated air is commonly lost to undetected leakages before it ever reaches an end-use tool or actuator.
By integrating in-line sensors with existing factory automation networks, maintenance teams can identify, isolate, and quantify these energy losses continuously. This automated tracking replaces the practice of periodic, paper-based manual surveys, converting compressed air management into a continuous feedback and monitoring process.
The Cost of Silence: Why Compressed Air is an ISO 50001:2018 Significant Energy Use
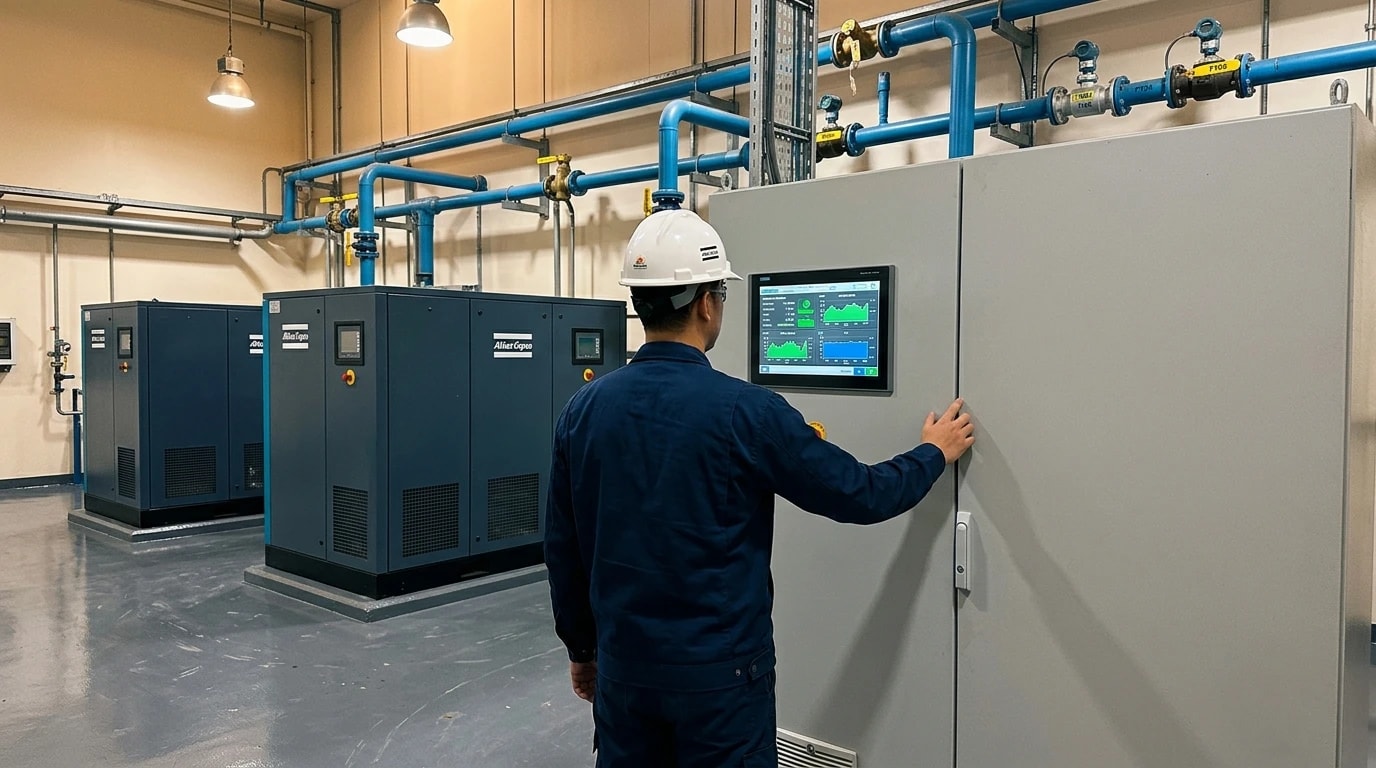
Under the ISO 50001:2018 energy management framework, industrial facilities must identify areas of Significant Energy Use (SEU). Any system or asset consuming a substantial proportion of facility energy, or displaying a high potential for efficiency improvement, qualifies for this designation. Compressed air networks almost universally meet both criteria.
The cost of maintaining a leaking network is substantial. For example, a single 3 mm orifice leak in a system operating at a pressure of 7 bar (approximately 100 psi) can waste more than €5,000 to €8,000 annually in electrical power. When a facility contains dozens or hundreds of these small connection failures, the cumulative loss impairs operational margins and increases Scope 2 emissions.
Establishing a rigorous SEU register under ISO 50001:2018 requires systematic baselining and continuous verification. Continuous telemetry provides the granular, audit-ready data required to satisfy compliance auditors. This approach replaces raw assumptions with verified consumption figures, linking utility performance directly to production metrics.

Omni Vision delivers turnkey utility metering, CO2 tracking, and AI-powered production KPI intelligence — giving you real-time dashboards and actionable insights across your entire facility.
The Limits of Manual Ultrasonic Audits vs Continuous Telemetry
Many manufacturing plants rely on manual ultrasonic walks to identify compressed air leaks. Typically scheduled once or twice a year, these campaigns involve technicians walking the production floor with handheld acoustic detectors, marking leaks with physical tags, and logging them in spreadsheets. While these surveys find immediate losses, they present severe structural limitations:
Temporal Decay: A manual walk represents a single snapshot in time. A fitting can fail or a hose can split the day after a survey is completed, allowing energy waste to continue unaddressed for months until the next scheduled audit.
High Resource Requirements: Detailed physical audits require dedicated maintenance hours and specialist technicians. In busy operational environments, urgent production concerns frequently delay these walk-throughs.
Inaccessibility: Many pneumatic lines run behind machinery guarding, overhead in pipe bridges, or inside complex process enclosures where manual measurement is impossible or unsafe.
Lack of Trend Analysis: Manual audits fail to capture how leak rates change under varying operating temperatures, shift patterns, or system pressures.
Continuous monitoring via PLC telemetry resolves these challenges by converting leak detection from a periodic maintenance chore into an automated, background-level diagnostics programme.
Hardware and Protocol Architecture for PLC-Based Telemetry
To achieve automated detection, process engineers integrate dedicated in-line instruments with existing programmable logic controllers. This section details the hardware and communication protocols that form the backbone of a telemetry network.
In-Line Thermal Mass Flow Sensors
Thermal mass flow sensors are the preferred device for continuous line monitoring. Instruments such as the SICK FTMg (Flow Thermal Meter for gases) operate on a calorimetric measurement principle to record flow velocity, mass flow, and temperature, alongside integrated piezoresistive sensors for pressure.
The SICK FTMg, available in nominal widths of DN15, DN20, and DN25, is capable of calculating and outputting eight distinct process parameters simultaneously, including cumulative energy consumption in kWh. These sensors provide a measurement accuracy of ±3 per cent of the measured value. This high dynamic range is vital, as it allows the sensor to detect very low flow velocities that indicate early-stage, minor leakages during non-production periods.
PLC Communication Protocols
Field data must traverse several layers of industrial network architecture to reach analytical platforms. Automation engineers typically utilise one of several communication paths:
IO-Link: Ideal for point-to-point connections between the field sensor and a local I/O hub. IO-Link transmits high-resolution process values along with device diagnostics directly to the PLC master module.
Modbus TCP/RTU: A standard, open protocol widely used for transmitting register data from flowmeters and pressure transmitters directly to controller inputs.
OPC UA (Open Platform Communications Unified Architecture): A platform-independent, service-oriented architecture. OPC UA allows Beckhoff TwinCAT 3 or Siemens TIA Portal environments to expose structured utility data directly to edge gateways or cloud systems.
MQTT (Message Queuing Telemetry Transport): A lightweight, publish-subscribe network protocol that is useful for pushing high-frequency sensor readings over restricted bandwidth connections.
The following diagram outlines the standard telemetry flow from field instruments through the automation layer to the analytical core:

Track energy consumption, emissions, and process parameters with seamless PLC/SCADA integration via Modbus, OPC-UA, and MQTT protocols.
Mathematical Diagnostics: Base Consumption and Anomaly Detection
Raw telemetry data alone does not locate leaks; it requires systematic mathematical analysis to isolate baseline usage from active line degradation. Process engineering teams utilise three core analytical methods to automate leak identification.
Base Consumption Monitoring during Shutdowns
The most reliable indicator of pneumatic system leakage is "base consumption". This refers to the residual flow rate measured during scheduled production pauses, such as weekend shutdowns, holiday periods, or overnight maintenance windows.
During a scheduled shutdown, all production machinery is offline, meaning the theoretical demand for compressed air should approach zero. Any residual flow recorded by the in-line thermal mass flow sensors represents active leakages. The telemetry system establishes a "zero-production baseline" by tracking flow rates during these idle hours. When this base consumption rises above a predetermined threshold (such as 15 per cent of average production flow), the system automatically flags a network compromise and triggers an alert for the maintenance team.
Pressure Decay Analysis in Idle States
For isolated machine cells or header sections, pressure decay testing can be automated directly within the PLC logic. When a specific production line enters an idle state, the PLC closes the isolation valves to seal that section of the pneumatic network.
Using pressure transmitters, such as a SICK PAC50, the controller monitors the rate of pressure drop over a fixed time interval (dt). The pressure decay profile is calculated using the relation:
dtdp=tend−tstartPstart−Pend
where:
dp/dt is the rate of pressure change over time (bar/minute)
Pstart is the initial pressure at the start of isolation (bar)
Pend is the final pressure at the end of the test period (bar)
tstart is the start time of the isolation test
tend is the end time of the isolation test
If the decay rate dp/dt exceeds the established baseline tolerance for that specific circuit, the PLC registers a leakage event, pinpointing the issue to a localised machine cell before it escalates.
Unsupervised Machine Learning and Anomaly Detection
While base consumption and pressure decay work well during idle states, identifying leaks during active production requires advanced analytical models. Because production demands fluctuate based on product mix, batch cycles, and machine states, simple threshold alarms often generate false positives.
To resolve this, cloud-integrated telemetry networks employ unsupervised machine learning algorithms:
Local Outlier Factor (LOF): LOF measures the local density deviation of a given data point relative to its neighbours. By comparing real-time flow and pressure combinations against historic clusters of normal operating states, LOF identifies anomalous high-flow, low-pressure points that indicate active, sudden leakages.
Autoencoders: These neural networks are trained exclusively on normal operational data representing a leak-free system. The model learns to compress and reconstruct the sensor inputs (flow, pressure, temperature, compressor motor current). When a leak develops, the sensor relationships deviate from the trained baseline, causing the reconstruction error to spike. When this error exceeds a statistical threshold, the system flags a leak.
Diagnostic MethodIdeal Operational StatePrimary Sensor InputsDetection TargetBase ConsumptionScheduled shutdowns (weekends/holidays)Thermal mass flow rateContinuous baseline leakage volumePressure DecayShort machine idle statesPressure transmittersLocalised physical line compromisesMachine Learning (LOF/Autoencoders)Active, variable productionFlow, pressure, motor current, batch IDComplex, dynamic leakages and regulator drift
Secure Integration with the Omni Vision Energy Intelligence Platform
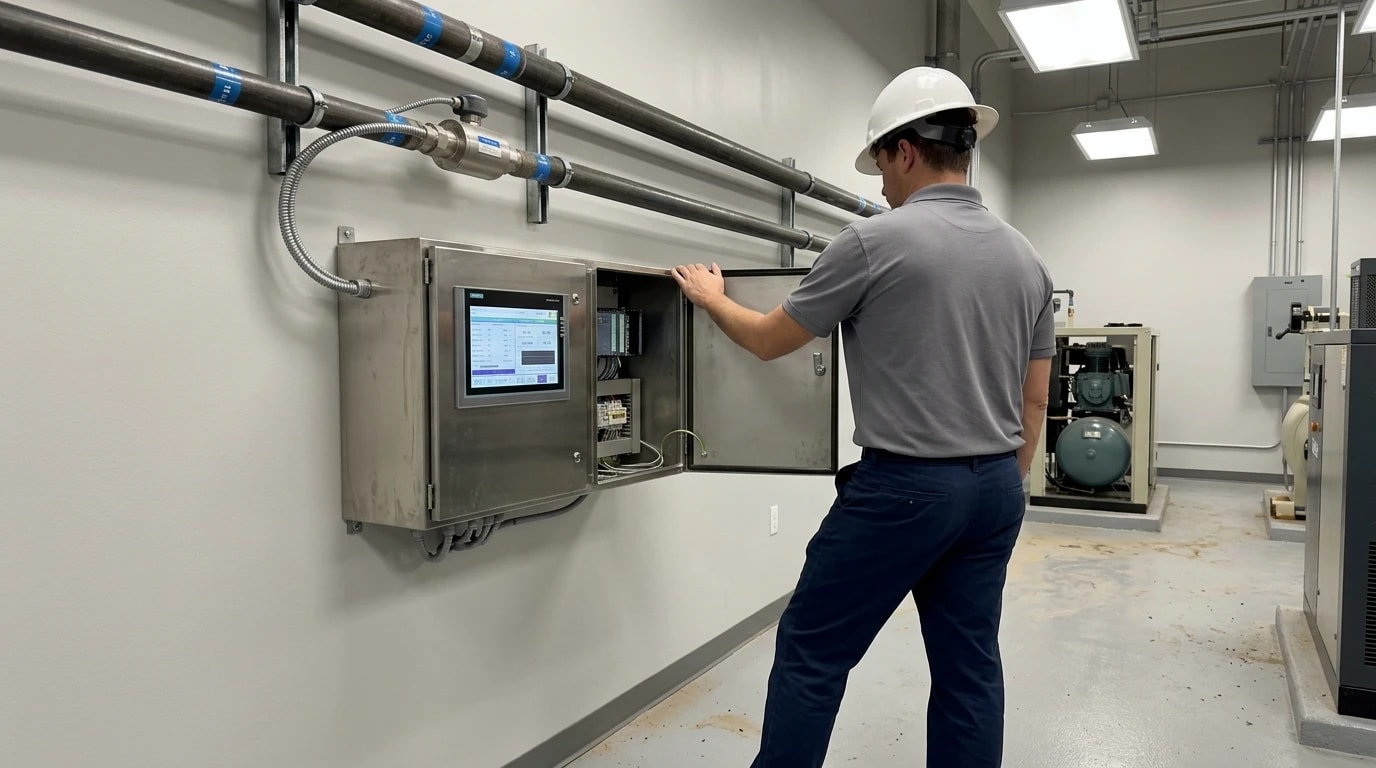
Implementing continuous compressed air monitoring requires a technical architecture that protects factory operational technology (OT) from external security threats. The Omni Vision Energy Intelligence Platform, developed by EnerTherm Engineering, solves this problem through a secure, non-invasive integration model.
The platform establishes connectivity with plant systems via standard protocols such as Modbus, OPC-UA, BACnet, and MQTT. Crucially, the deployment model utilises a secure, read-only gateway that enforces a one-way, encrypted cloud push. This architecture guarantees zero-write access to plant PLCs or safety networks, preserving the operational integrity and strict safety standards required in regulated environments, such as GMP (Good Manufacturing Practice) in pharmaceutical plants or HACCP (Hazard Analysis Critical Control Point) in food and beverage facilities.
Rather than running heavy processing scripts on the local PLC, the telemetry gateway pushes high-resolution data to the EPSA cloud-based AI analytics engine. This engine handles the complex mathematical modelling, such as autoencoder reconstructions and multi-variable baseline regression. The platform monitors six core utility streams: electricity, gas, water, steam, compressed air, and oil. This comprehensive tracking provides facility managers with a centralised view of resource usage. By linking production records directly to utility telemetry, the system calculates granular, production-linked Key Performance Indicators (KPIs), such as energy consumed per batch or compressed air volume per finished tonne.
Measurable ROI and Sustainable Compliance Reporting
Replacing manual walk-throughs with PLC-based telemetry delivers immediate financial returns and simplifies environmental compliance.
Financial ROI and Efficiency Gains
A standard installation of the Omni Vision platform is delivered via an 8-to-16-week turnkey deployment model. By continuously identifying and facilitating the repair of compressed air leaks, facilities typically achieve 15 to 25 per cent overall energy cost reductions, with some compressed air systems recording waste reductions of up to 30 per cent.
With these savings, most industrial installations achieve a sub-12-month return on investment (ROI). Because the platform utilises existing PLC hardware and sensors where possible, the initial capital expenditure remains low, avoiding the cost of redundant instrumentation networks.
Regulatory Alignment and Auditing
The continuous data captured by the platform provides audit-ready evidence for major regulatory frameworks and corporate reporting requirements:
ISO 50001:2018 Compliance: Automates the required Significant Energy Use (SEU) monitoring, baseline tracking, and Energy Performance Indicator (EnPI) calculations.
ESOS (Energy Savings Opportunity Scheme - UK): Provides the granular, multi-year utility data required for compliance assessments, removing the need for estimated consumption modelling.
SECR (Streamlined Energy and Carbon Reporting - UK): Automates the calculation of Scope 1 and Scope 2 CO₂ equivalent emissions from utility consumption, creating transparent, board-ready sustainability reports.
EU ETS (European Union Emissions Trading System): Supports accurate carbon accounting and verification by documenting continuous efficiency improvements over time.
By transitioning from manual surveys to continuous, automated PLC telemetry, manufacturing and process plants secure their utility lines, reduce electricity costs, and establish a foundation for long-term decarbonisation.
This article reflects the independent analysis and editorial opinion of EnerTherm Engineering. Product names, trademarks, and brands mentioned belong to their respective owners. EnerTherm Engineering is not affiliated with, endorsed by, or a licensee of any third-party software or product mentioned unless explicitly stated.

Technical Manager — EnerTherm Engineering
John Naranjo is Technical Manager at EnerTherm Engineering, bringing specialist expertise in chemical and environmental engineering. He recently led the implementation of Omni Vision, EnerTherm's real-time energy and utility monitoring platform. He holds an MSc in Environmental Engineering from the University of Huelva and a BSc in Chemical Engineering, with memberships in both the Energy Institute and IChemE.
