Process Model Validation Services to BS EN ISO 10012:2026
Resolving up to 10% mass imbalances via plant data reconciliation for UK chemical plants.
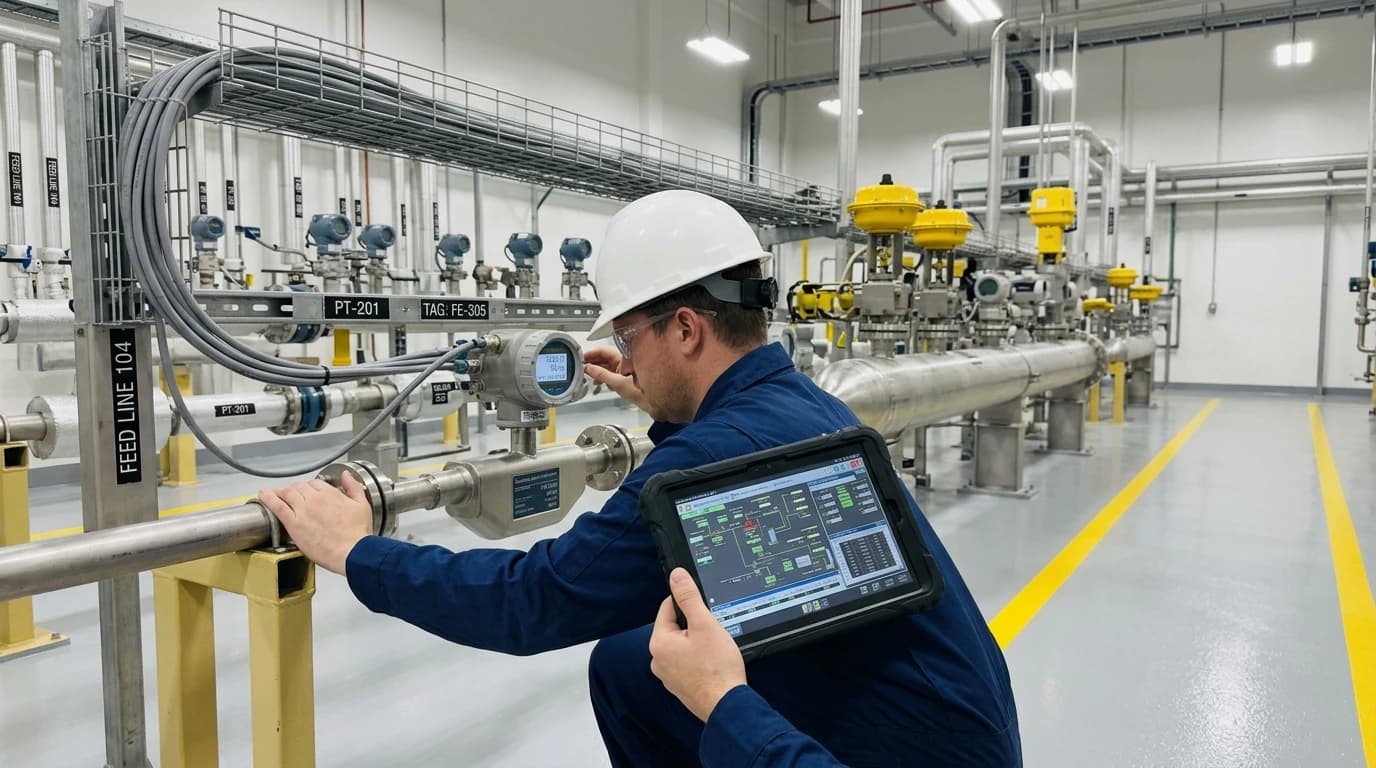
Process model validation services are specialised engineering activities that systematically verify, calibrate and validate mathematical process simulations – such as those built in Aspen Plus, HYSYS or DWSIM – against real-world plant operating data to ensure they obey thermodynamic, mass and energy conservation laws. In the petrochemical, speciality and fine chemical sectors, technical managers routinely use these simulations to support plant modifications, throughput expansion and carbon reduction programmes. However, raw measurement data gathered directly from plant sensors typically contains random noise, systematic drift or gross instrument errors. Running a process simulation based on these unreconciled measurements leads to erroneous mass and energy balances, resulting in flawed engineering designs, failed debottlenecking and misallocated capital.
Reconciling Plant Data Under the BS EN ISO 10012:2026 Framework
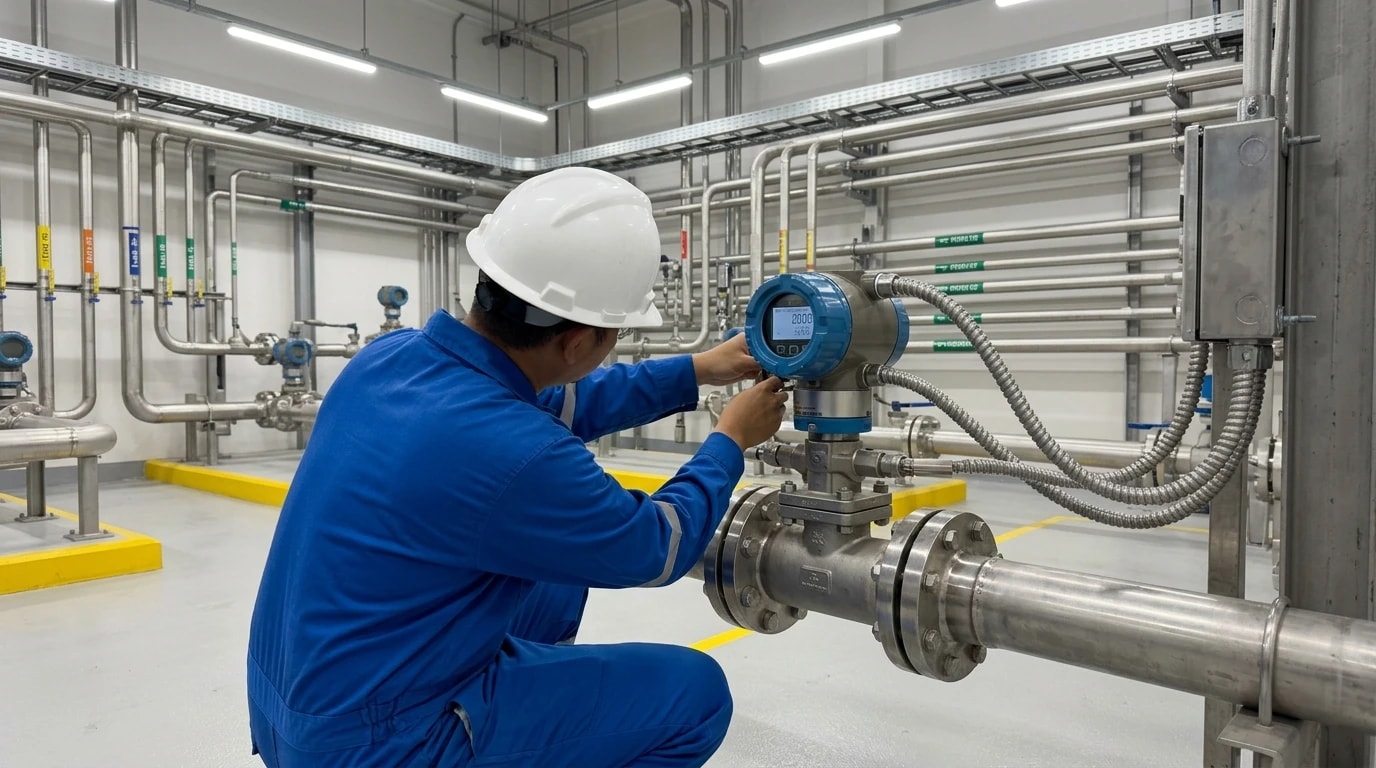
The newly revised BS EN ISO 10012:2026 standard (Quality management — Requirements for measurement management systems) is a fully auditable international standard governing how industrial processes establish the traceability, reliability and repeatability of raw measurement data. Published in February 2026, this major revision introduces the Annex SL high-level structure, aligning metrological management directly with other primary standards such as BS EN ISO 9001 and BS EN ISO 14001. For operations directors and technical managers in the UK chemical processing industries, this transition transforms how raw instrumentation data is certified and integrated into engineering models.
Transitioning from Isolated Calibration to Strategic Metrology
Historically, plant metrology focused on isolated instrument calibrations executed on rigid, calendar-based schedules. The BS EN ISO 10012:2026 standard replaces this practice with an integrated, risk-based Measurement Management System (MMS). This framework requires process plants to actively manage the lifecycle of all measurement processes and equipment, shifting the emphasis from simple hardware compliance to verifying the complete measurement process. For chemical processing plants, raw flow rates, temperatures and pressures must have a documented chain of traceability and a quantified margin of uncertainty before process engineers can utilise them for simulation modelling.
Pillar 1: Calibration Interval Optimisation
Chemical plants are moving away from fixed 12-month calibration cycles. Under BS EN ISO 10012:2026, engineers must deploy analytical methods, such as drift analysis and the OPPERET method, to dynamically adjust calibration intervals based on actual instrument performance and risk. This dynamic adjustment reduces unnecessary maintenance shutdowns and ensures that high-risk instruments, such as feedstock flowmeters or reactor temperature sensors, maintain accuracy over extended production campaigns.
Pillar 2: Measurement Uncertainty Integration
A raw measurement has no metrological validity without its corresponding uncertainty budget. The 2026 standard requires engineers to factor this "margin of doubt" into all downstream compliance and operational decisions. Technical teams utilise guard-banding techniques to reduce the probability of accepting out-of-specification process data, ensuring that only validated, high-confidence sensor data enters the reconciliation model.
Pillar 3: Metrological Risk Control
Technical managers must document and manage risks associated with measurement decisions. This involves calculating the probability of false acceptance (β or client risk) and false rejection (α or supplier risk). Process engineers utilise the Test Uncertainty Ratio (TUR) to establish high-confidence thresholds. For a petrochemical facility, establishing a high TUR ensures that mass and energy balances are built on verified, traceable measurements rather than drifted instrument readings.

Map every energy and material flow in your process with detailed heat and mass balance calculations — the foundation for any optimisation or design project.
Aligning Process Models with ASME VVUQ Guidelines
To establish a structured path to model credibility, engineering firms align their process model validation services with the American Society of Mechanical Engineers (ASME) Verification, Validation, and Uncertainty Quantification (VVUQ) guidelines. Raw, non-reconciled plant measurements almost always violate the fundamental conservation laws of thermodynamics, mass and energy. Instruments suffer from environmental noise, calibration drift and high process dynamics. The ASME VVUQ guidelines provide a systematic framework to quantify and reduce these discrepancies.
Code and Calculation Verification
Under the ASME VVUQ framework, verification represents the first line of defence against simulation error. Verification determines whether the computational model fits the mathematical description and code implementation. Code verification confirms that the simulation software correctly solves the underlying physical equations.
Calculation verification evaluates the specific user-built simulation files, verifying that numerical solvers converge, recycle loops close within tight tolerances and grid or step sizes do not introduce numerical errors. This stage must be completed before attempting to match the simulation to physical plant data.
Simulation Validation
Once verification is established, validation determines whether the process model accurately represents the real-world chemical process. Validation compares simulation outputs with physical measurements obtained directly from the plant. Under the ASME V&V 20-2009 standard (which covers computational fluid dynamics and heat transfer), validation is not a binary pass-fail assessment. Instead, it quantifies the degree of agreement between the model's predictive values and the physical measurements, accounting for the uncertainties present in both.
Uncertainty Quantification (UQ)
Process engineers evaluate how variations in feedstock composition, heat-exchanger fouling and ambient air temperature propagate through the physical plant and the simulation. UQ assigns quantitative confidence bounds to the final simulation predictions, giving decision-makers a clear understanding of the risks associated with the model's outputs.
The Mathematics of Data Reconciliation and Validation (DVR)
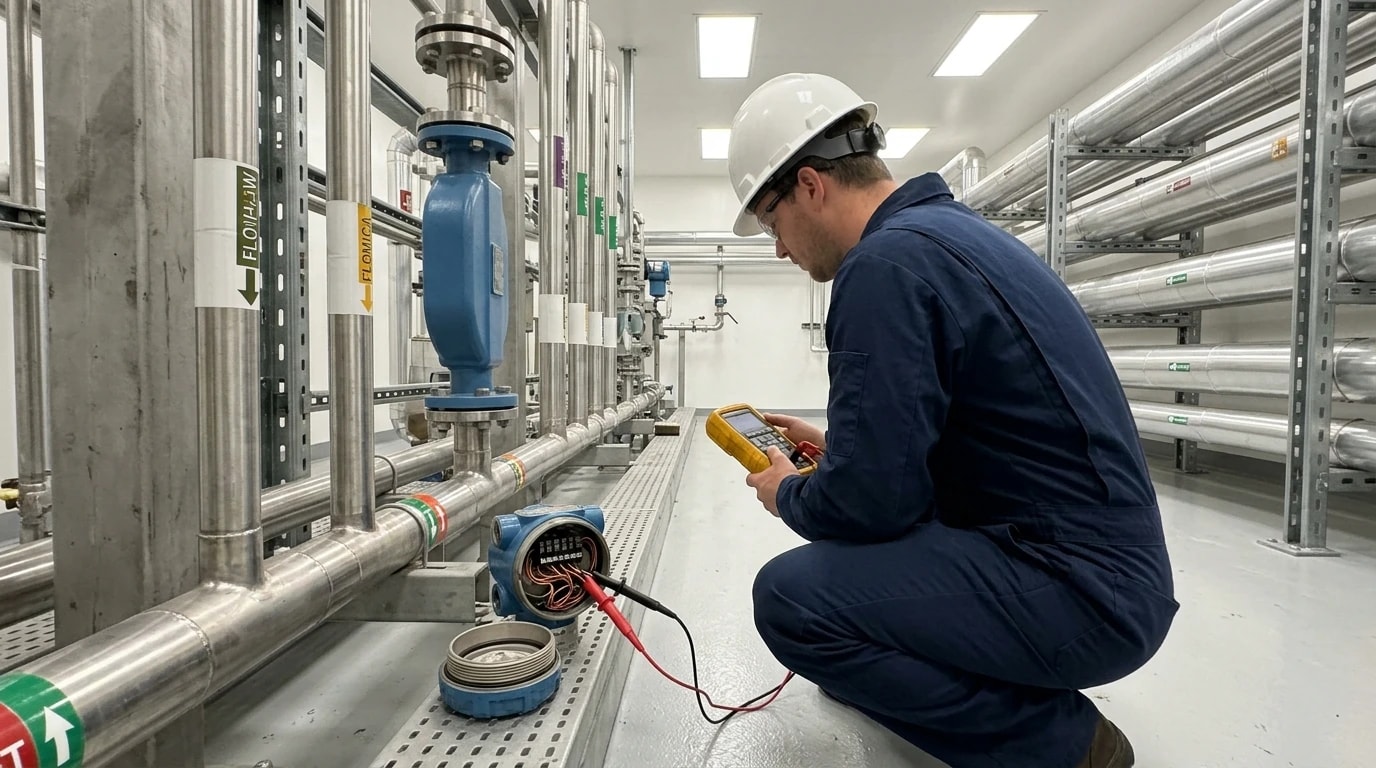
To bridge the gap between imperfect plant measurements and rigorous simulation models, engineers utilise Data Reconciliation and Data Validation (DVR) methodologies. Raw plant measurements violate physical laws because every sensor contains some degree of error. DVR resolves these discrepancies by mathematically adjusting the raw data so that the final reconciled data set complies perfectly with mass, energy and component balances.
Targeting Measurement Redundancy
A successful DVR system relies heavily on measurement redundancy, which occurs when the plant possesses more sensors than the minimum required to define the system's state. For example, if a plant measures the inlet flow, the outlet flow and the storage level of a vessel, the system is overdetermined. This redundancy provides the mathematical framework needed to calculate the most probable true value of each process variable.
Gross Error Detection (GED) and Isolating Sensor Drift
Raw data contains both random errors (which average to zero over time) and systematic gross errors (such as sensor bias, drifting calibration or total failure). GED uses statistical tests, such as the Chi-square (χ2) test, to flag and isolate these gross errors. If an algorithm flags an instrument, process engineers remove it from the active data set. This prevents the faulty sensor from corrupting the reconciliation of surrounding variables, ensuring that sensor drift does not distort the model calibration.
Mathematical Formulation of the DVR Objective Function
Data reconciliation mathematically formulates the adjustment of plant data as a constrained optimisation problem. The goal is to minimise the weighted sum of squares of the adjustments made to the measurements. The mathematical objective function (J) is represented as:
J=i=1∑n(σixi−yi)2where:
- J is the objective function to be minimised.
- n is the total number of measured variables.
- xi is the reconciled (estimated) value of variable i.
- yi is the raw measured value of variable i.
- σi is the standard deviation (representing the measurement uncertainty) of the corresponding sensor.
This optimisation is subject to a set of equality constraints that represent the physical laws of the process:
f(x)=0where f(x) represents the system of equations for the conservation of mass, species and energy, alongside thermodynamic equilibrium relationships. By minimising J, the algorithm makes the smallest possible changes to the measurements, weighting those changes based on individual sensor uncertainties. Highly accurate instruments (small σi) receive minimal adjustments, whereas less reliable sensors (large σi) are adjusted more significantly to close the balances.
Robust Estimators and Non-Linear Solvers
Standard least-squares objective functions are highly sensitive to gross errors. If a gross error escapes the initial detection phase, it can skew the entire reconciliation. To counter this, process engineers often use robust estimators, such as the Welsch, Lorentzian or Fair objective functions. These functions apply a quadratic penalty for small deviations but transition to a linear or constant penalty for larger deviations. This mathematical approach limits the impact of undetected outliers on the wider model, ensuring the simulation's integrity is preserved.
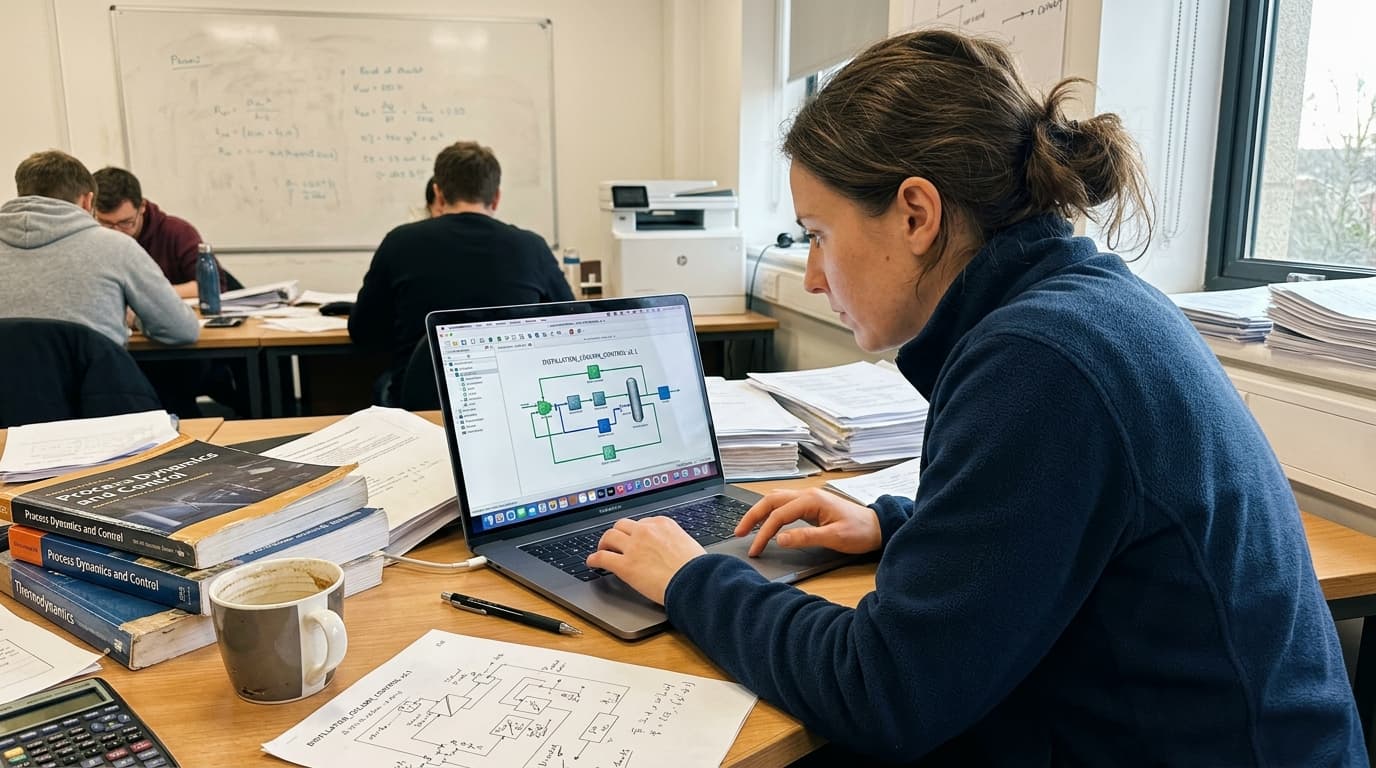
Map every energy and material flow in your process with detailed heat and mass balance calculations — the foundation for any optimisation or design project.
Simulating Complex Thermodynamics in Chemical Processing
To achieve high fidelity during process model validation services, the mathematical simulation must reflect the correct physical behaviour of the fluids under study. Process engineers often select specific thermodynamic packages to handle non-ideal mixtures, high pressures or reactive systems. Choosing an incorrect property method will yield invalid mass and energy balances, regardless of the quality of the reconciled plant data.
| Thermodynamic Package | Best Suited Applications | Physical Behaviour Modelled | Key Process Examples |
|---|---|---|---|
| NRTL / UNIQUAC | Non-ideal liquid mixtures at low-to-moderate pressures | Liquid activity coefficients, phase splits | Azeotropic distillation, ethanol-water separation, solvent extraction |
| Peng-Robinson (PR) | Hydrocarbons and light gases at high pressures | Gas-phase non-ideality, vapour-liquid equilibrium (VLE) | Refinery gas processing, crude oil separation, ethylene fractionation |
| Soave-Redlich-Kwong (SRK) | Polar and non-polar hydrocarbon systems | Gas-phase thermodynamic properties, compressibility | Natural gas processing, petrochemical synthesis loops |
Activity Coefficient Models (NRTL and UNIQUAC)
For highly non-ideal liquid mixtures at low to moderate pressures, process engineers typically select activity coefficient models such as Non-Random Two-Liquid (NRTL) or UNIQUAC. These models are essential for predicting phase behaviour in speciality and fine chemical processes, particularly where multi-component azeotropic or reactive distillation occurs. They accurately model vapour-liquid equilibrium (VLE), liquid-liquid equilibrium (LLE) and vapour-liquid-liquid equilibrium (VLLE). Calibrating these models requires high-quality binary interaction parameters, which engineers validate against actual plant decanter or column temperature profiles.
Equations of State (Peng-Robinson and SRK)
In high-pressure petrochemical applications involving hydrocarbons, light gases and supercritical fluids, thermal design teams rely on the Peng-Robinson (PR) or Soave-Redlich-Kwong (SRK) equations of state. These models accurately predict vapour-liquid equilibrium (VLE) and volumetric properties over a wide range of temperatures and pressures. When validating columns operating near critical points, such as demethanisers or deethanisers, these equations of state prevent the model from predicting non-physical phase behaviour.
Reactor Kinetics and Recycle Loop Convergence
Chemical and petrochemical processes feature complex reactor configurations and extensive material recycle loops.
- Reactor Kinetics: Process model validation services must calibrate the kinetic parameters of exothermic or endothermic reactions. Validating these models involves reconciling the feed composition, reactor temperature profiles and cooling or heating utility duties. This ensures the simulation accurately predicts reaction conversion, selectivity and thermal runaway risks.
- Recycle Loop Convergence: Recycles propagate errors throughout a simulation. A minor imbalance in a reactant or inert species can cause a simulation recycle loop to diverge, or it can converge on an infeasible operating state. Engineers systematically break these loops during the validation phase, reconciling individual equipment balances before closing and converging the complete recycle network.
EnerTherm's 11-Step Heat and Mass Balance (HMB) Methodology
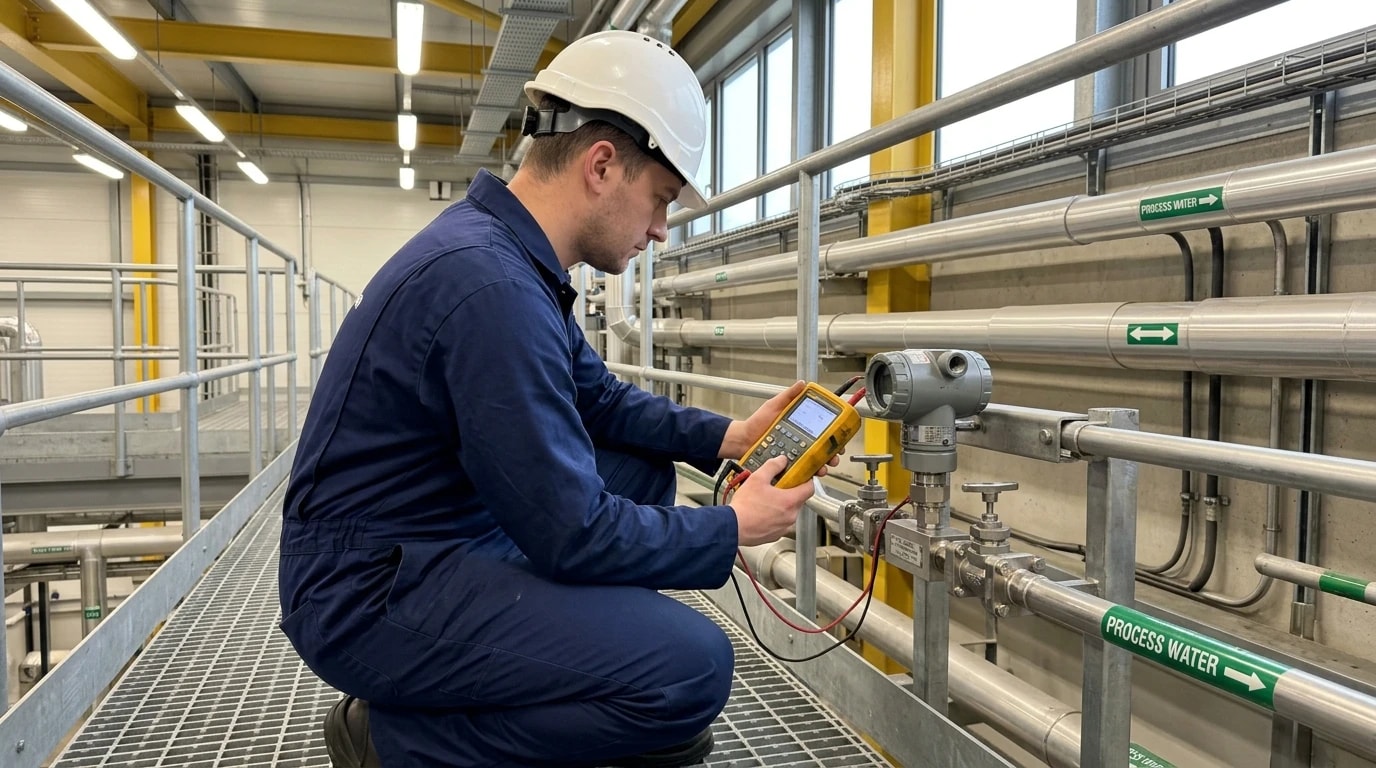
EnerTherm Engineering delivers process model validation services through a structured, 11-step Heat and Mass Balance (HMB) engineering framework. This methodology standardises the transition from raw plant data to a certified, fully validated process model that serves as a single source of truth for the entire facility.
Phase 1: Data Acquisition and Metrological Auditing
- Step 1: Project Scoping and Boundary Definition: Engineers establish the physical and thermodynamic boundaries of the process unit to be modelled, defining which inputs, outputs and utility streams are included.
- Step 2: P&ID and PFD Review: The team reviews piping and instrumentation diagrams (P&IDs) and existing process flow diagrams (PFDs) to map the physical layout and connectivity of the equipment.
- Step 3: Historical Log and SCADA Data Extraction: Process engineers extract historical operating logs, SCADA data and historian records. This provides a continuous time-series data set covering steady-state operations and typical process upset scenarios.
- Step 4: Metrological Audit (BS EN ISO 10012:2026): The team audits the plant's measurement management system. They review calibration certificates, sensor tolerances and metrological records to determine the uncertainty values (σi) of key instruments.
Phase 2: Simulation Construction and Mathematical Reconciliation
- Step 5: Base Simulation Construction: Engineers construct the initial process simulation in the designated software platform (such as Aspen Plus, HYSYS or DWSIM), configuring the correct thermodynamic property packages.
- Step 6: Data Reconciliation (DVR): The team applies data reconciliation algorithms to resolve mass and energy imbalances across the raw data set, identifying and isolating gross sensor errors.
- Step 7: Parameter Calibration: The reconciled plant data is used to calibrate key simulation parameters, such as heat-exchanger fouling factors, distillation tray efficiencies and chemical reactor conversion rates.
- Step 8: Model Verification (ASME VVUQ): The calibrated model is tested against an independent set of plant operating data (not used during the calibration phase) to verify its predictive accuracy under different load conditions.
Phase 3: Deliverables and Actionable Insights
- Step 9: Final Heat and Mass Balance Generation: The simulation compiles the final, closed HMB stream tables, containing exact chemical species flow rates, temperatures, pressures, enthalpies and physical properties.
- Step 10: Sankey Energy Mapping and PFD Creation: EnerTherm compiles a high-fidelity PFD containing embedded stream tables and Sankey diagrams that visually map the flow of energy and identify thermodynamic losses.
- Step 11: Actionable Optimisation Reporting: The final report details equipment sizing summaries (such as heat exchanger area margins and reactor heat duties) and delivers concrete recommendations for debottlenecking, yield optimisation and carbon reduction.
Delivering Business Outcomes: Debottlenecking and CO₂ Mitigation
Investing in process model validation services yields tangible financial and operational benefits for UK chemical manufacturers. Unvalidated process simulations introduce substantial risk; if an engineering team designs a major modification based on incorrect mass and energy balances, the modified plant may fail to achieve design capacity or operate unsafely.
Minimising Risk in Capital Expenditure (CapEx) Projects
When executing debottlenecking projects, process engineers must identify the true limiting constraints of the process. An unvalidated simulation model may suggest that a distillation column is vapour-limited, prompting an expensive tray replacement. However, validation against reconciled plant data might reveal that the actual bottleneck is a downstream heat exchanger suffering from excessive organic fouling. By identifying the true limiting constraints, technical managers avoid misallocating capital expenditure and focus modifications where they will yield the highest return on investment.
Accelerating Carbon Reduction and Energy Efficiency Initiatives
Under the BS EN ISO 14001 framework and UK industrial decarbonisation mandates, chemical processors must actively reduce their greenhouse gas emissions. Process model validation services provide the baseline required to design energy recovery schemes. For instance, validating a heat-exchanger network model allows thermal engineers to identify pinch-point violations and design optimal heat integration schemes (such as preheating feed streams using column overhead vapours). Accurate mass and energy balances ensure that heat recovery systems operate reliably without upsetting column temperature profiles, directly reducing steam consumption and CO₂ emissions.
Enhancing Regulatory Compliance and Auditing
In highly regulated environments like petrochemical and speciality chemical manufacturing, compliance audits demand transparent, auditable decision-making processes. Adopting a model validation framework that aligns with BS EN ISO 10012:2026 and ASME VVUQ guidelines ensures that all engineering simulations are backed by fully traceable, reconciled measurement data. This level of documentation satisfies internal quality management audits and external regulatory bodies, proving that safety margins, emissions calculations and equipment capacities are based on physical reality rather than simulation software defaults.
This article reflects the independent analysis and editorial opinion of EnerTherm Engineering. Product names, trademarks, and brands mentioned belong to their respective owners. EnerTherm Engineering is not affiliated with, endorsed by, or a licensee of any third-party software or product mentioned unless explicitly stated.

Managing Director — EnerTherm Engineering
Dr. François Pierrel is Managing Director of EnerTherm Engineering with over two decades of expertise in thermal design, heat transfer, and industrial energy optimisation. He holds a PhD in Heat Transfer from Cranfield University and a Post-Doctorate from Heriot-Watt University.
