Why Pharmaceutical Thermal Modelling Depends on Batch Data
How batch-phase heat loads support GMP validation and defensible utility sizing.
Thermal modelling of pharmaceutical processes uses time-resolved mass, energy and thermodynamic data to predict how a batch changes during charging, heating, reaction, cooling, crystallisation, solvent recovery and discharge.
A reactor jacket may see its peak duty within minutes of an addition, then spend hours removing a smaller reaction load. A solvent-recovery still may draw maximum steam during heat-up but become condenser-limited as composition shifts. A single average value for the batch conceals both conditions.
Batch data is central to defensible pharmaceutical heat and mass-balance work. P&IDs, equipment data sheets and design conditions establish the physical model. Batch records, historian trends and laboratory results establish how the equipment performs with real materials, timings and operating decisions.
For UK and EU pharmaceutical sites, this is also a GMP matter. A thermal model used to support utility changes, process optimisation or equipment qualification must show its inputs, assumptions, version history and acceptance criteria. It must reflect operating ranges relevant to product quality and patient safety.
Why batch data changes pharmaceutical thermal modelling
A batch is a sequence, not a steady state
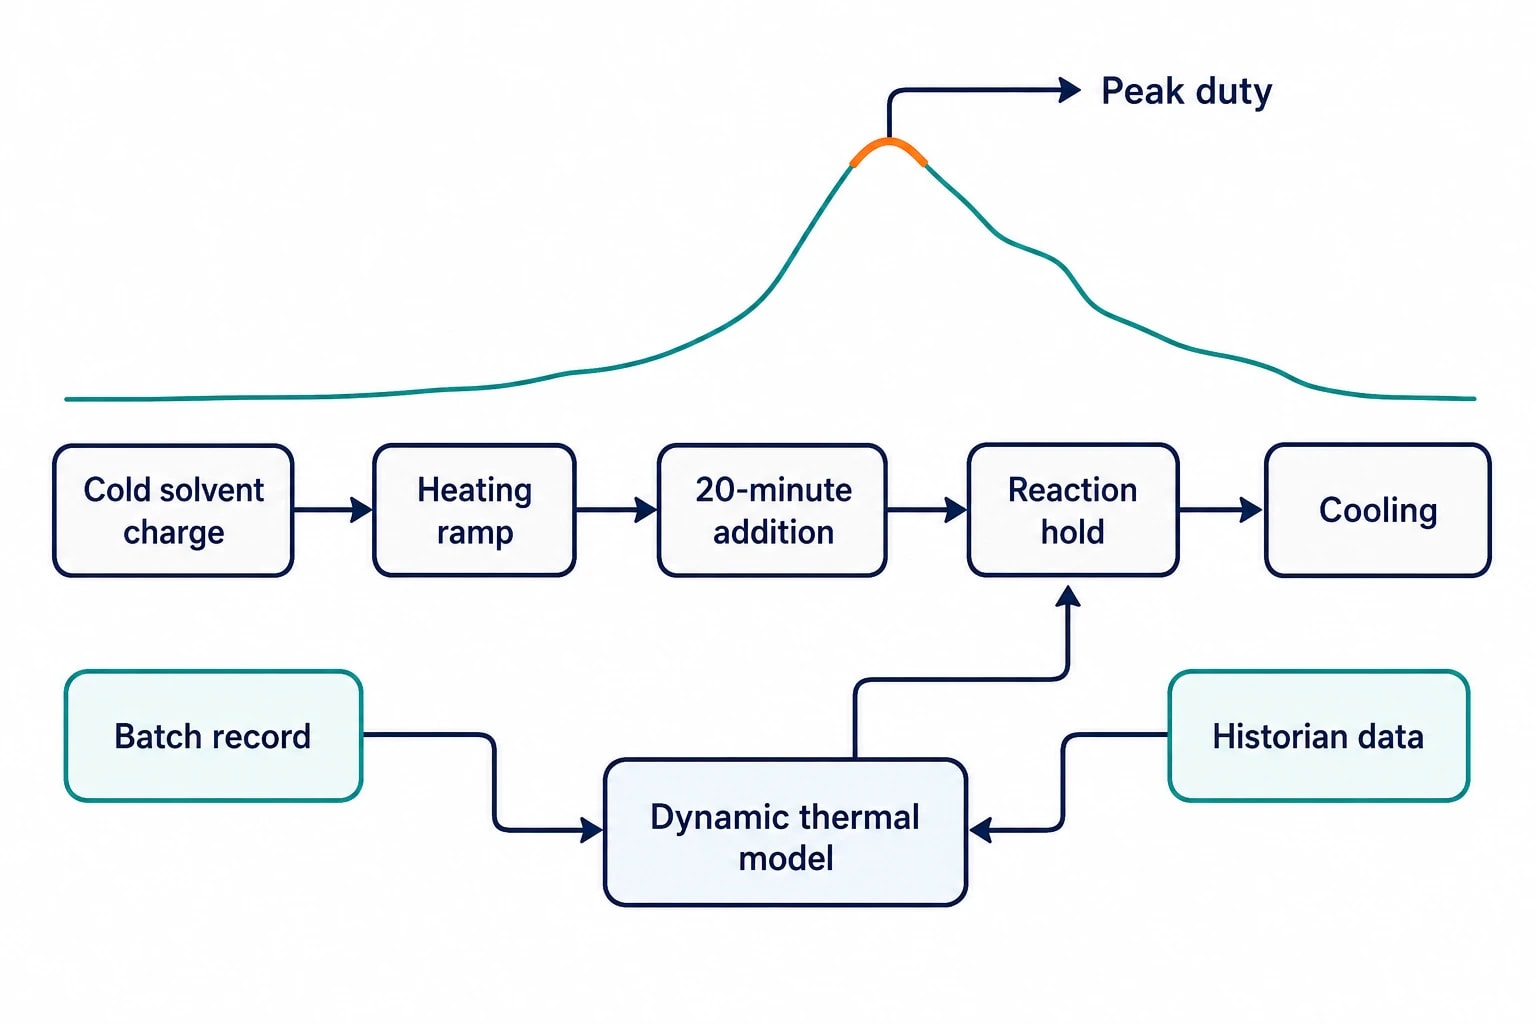
Batch manufacturing contains discrete events. Raw materials arrive at different temperatures. Operators charge solvents over a defined period. Agitation changes. A reaction begins, accelerates, then decays. Cooling may be held while a crystallisation seed takes effect. Vacuum may be introduced before distillation or drying.
Each event changes the heat and mass balance.
A steady-state calculation can still support preliminary utility sizing, such as the continuous cooling load needed to maintain a reactor at a specified temperature. It cannot describe the thermal demand created by a 20-minute reagent addition, the heat stored in the vessel wall during a ramp, or the transient loss of condenser capacity as vapour composition changes.
Dynamic thermal modelling needs data indexed to the batch sequence. The model should align measurements to meaningful process phases rather than treating the campaign as one operating point.
Typical phase markers include:
- Vessel preparation and inerting
- Solvent and raw-material charging
- Heating or cooling ramps
- Controlled addition periods
- Reaction hold
- Crystallisation, filtration or phase separation
- Distillation, solvent swap or solvent recovery
- Vacuum drying and discharge
- Cleaning, sterilisation or thermal sanitisation where utilities are in scope
The batch record provides the event logic. Historian data provides the time-resolved evidence. Neither source alone is sufficient.
Average values hide peak utility demand
A monthly steam total can demonstrate cost exposure. It cannot size a steam control valve, clean-steam generator, chilled-water header or condenser.
Consider a reactor that receives a cold solvent charge, heats to reaction temperature, receives an exothermic addition and then holds at temperature. The average cooling duty over the batch could appear modest. The jacket, control valve and chilled-water distribution system must nevertheless accommodate the maximum credible load without loss of temperature control.
The same issue affects facility utility assessments. Peak demands from several vessels can overlap during common production schedules, CIP operations or sterilisation cycles. A thermal model based only on typical batch averages may understate coincidence and create a utility bottleneck that appears only during production.

Map every energy and material flow in your process with detailed heat and mass balance calculations — the foundation for any optimisation or design project.
What data a dynamic heat and mass balance needs
Start with a controlled data set
The objective is not to collect every available historian tag. It is to collect enough traceable information to close the mass balance, explain the heat balance and test the model against batch behaviour.
The data set should identify source system, tag name, engineering unit, sampling interval, calibration status where applicable, batch identifier and time basis. A model can then distinguish a missing measurement from a real zero, and a corrected batch record from the original entry.
| Data group | Examples | Why it matters to the thermal model |
|---|---|---|
| Batch sequence | Start and end times, additions, holds, agitation changes, vacuum steps | Establishes the dynamic model structure |
| Material inventory | Charged masses, assay, density, solvent identity, mother-liquor and product mass | Closes species and total mass balances |
| Process conditions | Vessel temperature, pressure, level, agitator speed, reflux rate | Defines process state and phase behaviour |
| Utility measurements | Supply and return temperature, flow, pressure, steam use, condensate return | Quantifies heat transfer and utility demand |
| Equipment information | Vessel volume, jacket volume, heat-transfer area, insulation, exchanger area | Provides the physical basis for calculations |
| Quality and laboratory results | Assay, water content, solvent composition, yield, particle-size results where relevant | Tests material disposition and identifies variable inputs |
| Deviations and interventions | Alarm response, altered ramp, delayed addition, maintenance activity | Separates normal operation from exceptional batches |
In practice, time synchronisation is often the first technical problem. A batch record might state that charging began at 10:00. The control-system clock may be offset, and the load-cell trend may only show the practical start several minutes later. The modelling record should document the alignment method and retain the unprocessed data.
Mass data drives energy accuracy
The sensible heat needed to raise a vessel charge depends on the quantity and composition of material in the vessel at that moment. An inaccurate charge mass produces an inaccurate energy requirement before advanced thermodynamics enters the model.
For solvent systems, component identity and composition matter as much as total volume. Heat capacity, density, vapour pressure and latent heat vary between solvents and mixtures. Water introduced through a wet raw material, rinse, catalyst slurry or transfer-line flush can affect both reactor heating duty and vapour load on a downstream condenser.
Solid additions demand equal care. A powder charged at ambient temperature may dissolve with an observable thermal effect. A slurry can introduce a significant solvent mass. Crystallisation and dissolution can add or remove heat that a model must represent if the duty sits near a utility constraint.
Mass-balance reconciliation should precede detailed energy interpretation. Where measured inputs and outputs fail to reconcile, the team should investigate unrecorded rinses, incorrect density conversion, vessel heel, sampling losses, evaporative loss or timing errors. Forcing an energy model to absorb a material error through an arbitrary heat-transfer coefficient produces a misleading result.
Thermal and utility data must describe both sides of the exchanger
Reactor temperature alone does not quantify jacket duty. The model needs utility-side evidence wherever measurements allow it.
For heating and cooling circuits, useful variables include supply and return temperature, measured flow, pressure, control-valve position and temperature setpoint. For steam systems, the model should distinguish steam pressure, estimated or metered steam flow, condensate condition and condensate return path. For reflux and recovery systems, condenser coolant conditions, receiver accumulation and vacuum pressure may be decisive.
The heat-transfer coefficient is rarely a fixed plant constant. It can change with batch volume, viscosity, agitation, jacket flow regime, fouling and the difference between a clean reactor and one approaching campaign end. Batch data exposes this variation. Engineers can then establish a justified coefficient range or represent changes by phase.
How batch phases build a credible dynamic model
Charging and heat-up establish the baseline
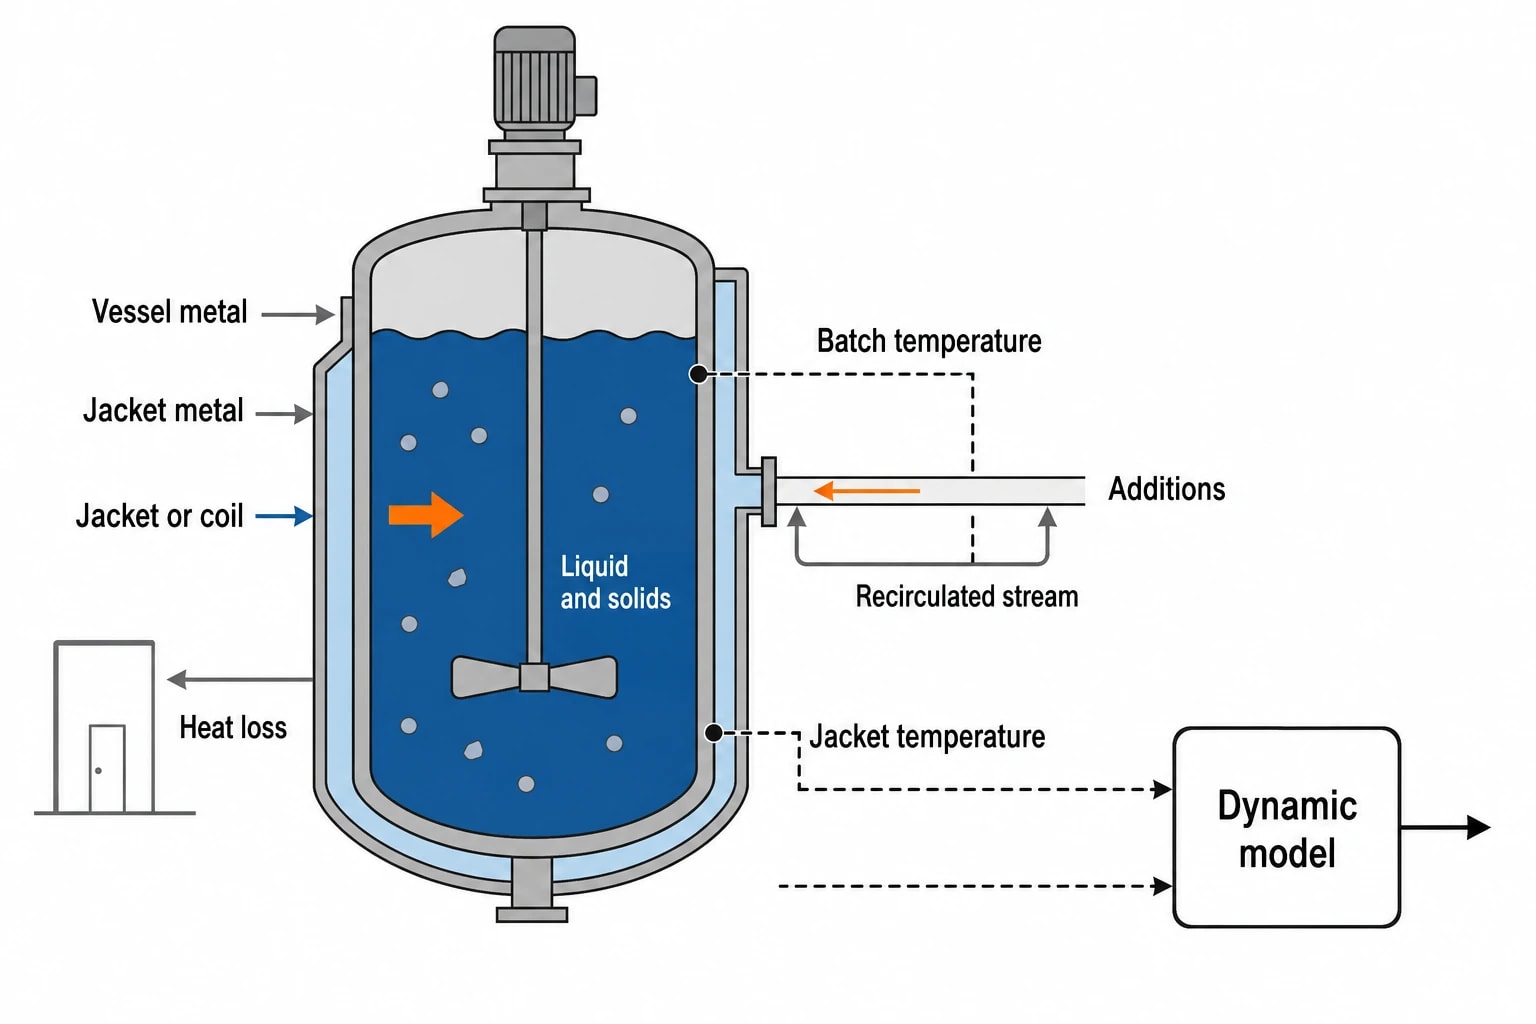
The initial reactor inventory and charge temperatures provide the first heat-load calculation. This stage is useful for checking vessel heat capacity, jacket response, losses to the room and utility-flow assumptions.
A model should separate:
- Heat absorbed by liquid and solids
- Heat absorbed by the vessel, internals and jacketed metal
- Heat lost through insulation and exposed surfaces
- Heat transferred through the jacket or coil
- Heat entering with additions or recirculated streams
Heat-up data is often cleaner than reaction data because the chemistry is inactive or limited. It can help estimate vessel thermal inertia and check whether design drawings match the installed equipment.
Reaction phases require time-resolved additions
A reaction heat load is tied to the rate of reaction, which changes over time. In a plant setting, direct calorimetric data may be limited. Batch temperature trends, addition rate, cooling response, reflux behaviour and laboratory results can still constrain the model.
The model should record whether heat removal arose from reaction, mixing, sensible cooling of an addition, evaporation or several effects at once. A fast addition can create a local or bulk temperature response that appears later in an averaged historian trend. Sampling intervals must suit the fastest relevant event.
For safety and facility design, engineers should test credible operating cases rather than only a nominal batch. These can include the fastest approved addition rate, high-assay raw material, high initial temperature, reduced cooling-water temperature difference, maximum batch mass and a conservative heat-transfer assumption.
This approach does not replace a reaction-calorimetry study where that study is required for process safety. It connects existing process knowledge to plant utility and temperature-control limits.
Cooling, crystallisation and filtration expose changing resistance
Cooling duty usually declines as the reactor approaches its target temperature. Crystallisation complicates the picture. Solids formation can alter slurry viscosity, agitation behaviour and heat transfer. A control valve that behaved well during a clear-solution cool-down can become unstable when the slurry thickens.
Batch records can identify the practical onset of seeding, cooling holds and filtration preparation. Coupling these events with agitator power, jacket temperatures and product results helps a model reflect conditions that affect cycle time and heat-transfer performance.
The output should be useful to operations. It may identify a cooling-ramp limit that protects slurry behaviour, a utility constraint during parallel batches, or a recurring hold whose duration increases after an equipment change.
Distillation and solvent recovery depend on composition
Solvent recovery models require a component-level mass balance. The vapour leaving a vessel is rarely compositionally constant throughout the operation. As volatile components leave, the pot composition changes. So do boiling temperature, vapour generation rate, condenser load and receiver composition.
For a practical model, batch data should capture:
- Initial solvent inventory and composition
- Vacuum pressure and its variation through the run
- Heating-medium conditions
- Reflux or distillate collection rate
- Condenser coolant supply and return conditions
- Receiver mass or level trend
- Laboratory composition data where available
- Residual solvent or final concentration results
This evidence supports reconciliation of recovered solvent against charged solvent, product retention, vessel heel, samples and expected losses. It also allows the engineering team to distinguish a heat-transfer limitation from insufficient condenser capacity, vacuum instability or an unrealistic batch schedule.
Map every energy and material flow in your process with detailed heat and mass balance calculations — the foundation for any optimisation or design project.
Which batch data is fit for a GMP-supported model?
Traceability matters as much as technical detail
A model supporting GMP decisions needs a defined intended use. A screening model for an early energy audit has different evidence requirements from a model used to assess reactor replacement, clean-utility capacity or post-change requalification.
EU GMP Annex 15 requires manufacturers to identify validation work needed to demonstrate control of critical aspects of their operations. It also directs manufacturers to validate significant changes to facilities, equipment and processes that may affect product quality, using risk assessment to determine the scope and extent of validation.
For thermal modelling of pharmaceutical processes, that means a protocol should define:
- The decision the model will support
- Model boundary and exclusions
- Input data sources and data-quality checks
- Thermodynamic method and physical-property sources
- Assumptions, parameter ranges and conservative cases
- Critical process parameters and relevant acceptance criteria
- Verification batches or independent operating periods
- Deviation handling, approvals and model version control
- Change-control triggers and requalification assessment
A process model should not acquire validation status through a software name. The evidence lies in its intended use, traceable inputs, documented assumptions and demonstrated agreement with suitable production data.
Model verification needs more than one favourable batch
One well-recorded batch can reveal a data issue or establish a preliminary parameter estimate. It does not necessarily represent the operating range.
Model verification should use batches selected for relevant conditions, such as batch size, seasonal utility temperature, material assay, solvent content, campaign position and production recipe. The selection must be scientifically justified. The model should then compare predictions against measured outcomes related to its intended use, such as peak jacket duty, time to target temperature, condenser return temperature, recovered solvent mass or final vessel inventory.
Acceptance criteria should match the decision risk. A model used to flag whether a chiller header faces a likely capacity shortfall needs conservative, demonstrably protective peak-duty predictions. A model used to investigate a two-minute heat-up discrepancy needs time alignment and temperature-trajectory accuracy at finer resolution.
ICH Q9(R1) frames quality risk management as a documented process for assessment, control, communication and review. Its revised guidance addresses subjectivity and clarifies risk-based decision-making. Applied to thermal models, uncertainty should be stated, assessed and carried into the engineering recommendation. A predicted duty range, supported by source data and sensitivity testing, provides a clearer basis for decision-making than a single precise-looking value.
Clean utilities need batch and continuous data
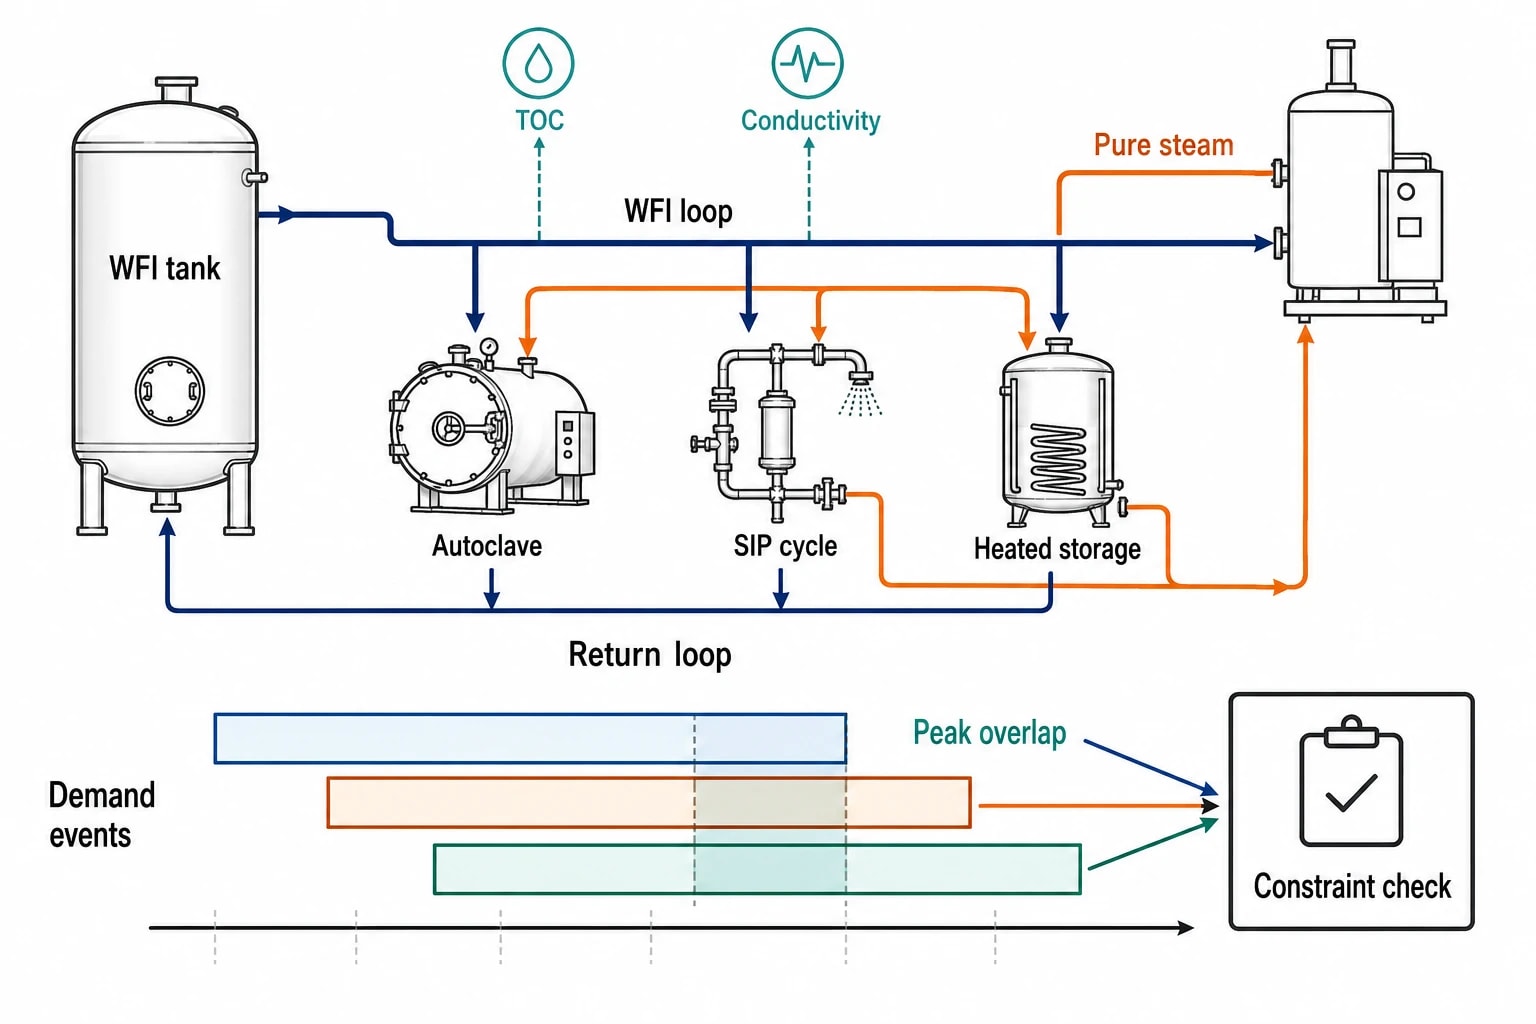
WFI and pure steam are thermal systems with quality constraints
Clean-utility models often begin with generation capacity. They should extend to distribution, sanitisation loads, user demand profiles, return conditions and water-quality controls.
The revised EU GMP Annex 1 became applicable on 25 August 2023, except for point 8.123, which became applicable on 25 August 2024. For WFI systems, it calls for continuous monitoring systems such as total organic carbon and conductivity, with sensor locations based on risk. These signals provide process evidence alongside routine sampling and microbiological controls. Their value to a thermal assessment lies in time-resolved system behaviour: temperature excursions, sanitisation recovery, return-loop conditions and the relationship between demand events and water quality.
Annex 1 also states that condensate from pure steam used as a direct sterilising agent must meet the current WFI monograph of the relevant Pharmacopoeia. A pure-steam capacity model must preserve quality constraints while assessing heat demand. Increasing generation rate, changing feedwater conditions or altering condensate return arrangements may affect more than utility consumption.
Batch schedules create clean-utility peaks
Autoclaves, SIP cycles, WFI distribution and heated storage tanks produce demand patterns that can overlap with manufacturing operations. Average daily use conceals the peak. The model should map each demand event by start time, duration, flow or steam demand and required pressure or temperature.
This enables a facility model to test realistic production schedules, including simultaneous sterilisation cycles and batch activities. The result can show whether the practical constraint lies in generation, distribution pressure loss, storage capacity, condensate removal or sequence of operations.
Turning a model into a change-control tool
Model outputs should connect to the process flow diagram
The most useful deliverable is a controlled process flow diagram with stream tables, mass and energy balances, model boundary, operating cases and design assumptions. It gives operations, engineering and quality teams a common reference.
For a reactor system, stream tables may identify raw-material charges, vent losses, condenser return, recovered solvent, jacket utility, clean steam and condensate. For a clean-utility study, they may identify generation, storage, distribution loops, user points and returns.
The document should distinguish measured values from calculated values. It should identify data gaps rather than bury them inside a calculation. That distinction matters when a future change reopens the assessment.
Use the model before a plant change
Thermal models are particularly useful during changes involving:
- A larger or differently jacketed reactor
- A revised batch size or charge sequence
- New solvent, raw-material supplier or assay range
- Altered addition rate or reaction hold
- Chilled-water, glycol, steam or condenser modifications
- Solvent-recovery capacity changes
- WFI, pure-steam or thermal-sanitisation changes
- Revised production schedule or parallel batch campaign
The change-control assessment should test the approved operating range and identify whether the change alters peak load, heat-transfer performance, batch time, material inventory or clean-utility quality controls. Where the assessment identifies a possible impact on critical process parameters or product quality, the site can define targeted verification or requalification work before implementation.
This article reflects the independent analysis and editorial opinion of EnerTherm Engineering. Product names, trademarks, and brands mentioned belong to their respective owners. EnerTherm Engineering is not affiliated with, endorsed by, or a licensee of any third-party software or product mentioned unless explicitly stated.

Managing Director — EnerTherm Engineering
Dr. François Pierrel is Managing Director of EnerTherm Engineering with over two decades of expertise in thermal design, heat transfer, and industrial energy optimisation. He holds a PhD in Heat Transfer from Cranfield University and a Post-Doctorate from Heriot-Watt University.
