How Aspen Plus Maps Steam Losses Across a Kraft Mill
A mill-wide model validation method for steam, drying and water-loop losses.
Aspen Plus pulp and paper simulation is a process-modelling method that reconciles steam, condensate, water, energy and chemical species across a kraft mill to identify where heat is generated, used, downgraded, recovered or discharged.
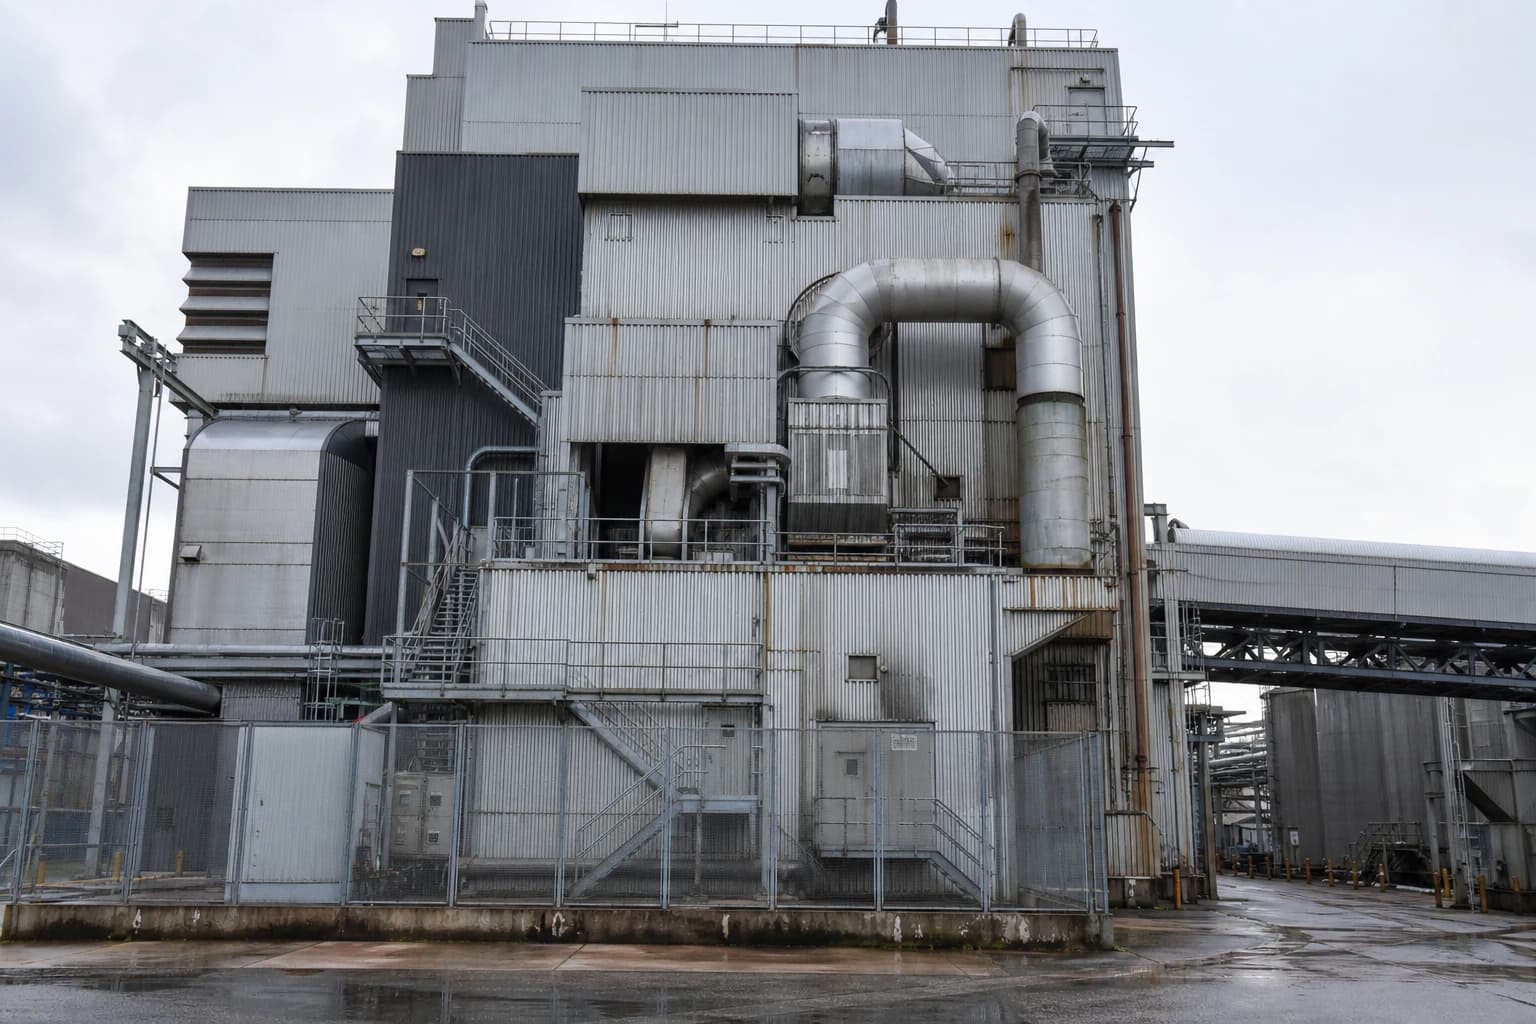
A recovery boiler may appear to meet the mill’s steam demand while avoidable losses remain distributed across the site. Low-pressure steam may be supplied above a dryer group’s actual requirement. Flash steam may vent from a separator. Hot condensate may bypass the boiler-feedwater system. Extra dilution water can increase black-liquor evaporation and raise live-steam demand.
Each issue has a different physical cause. A mill-wide heat and mass balance connects them.
For UK mills, the existing EU Best Available Techniques Conclusions continue to have effect through the European Union (Withdrawal) Act 2018. Commission Implementing Decision 2014/687/EU remains relevant to permit and energy-management discussions. BAT 6 calls for reduced fuel and energy consumption through an energy-management system and measures including excess-heat recovery, thermo-compressors, insulation of steam and condensate fittings, and matching steam pressure to actual process needs.
Why Aspen Plus pulp and paper simulation needs a mill-wide boundary
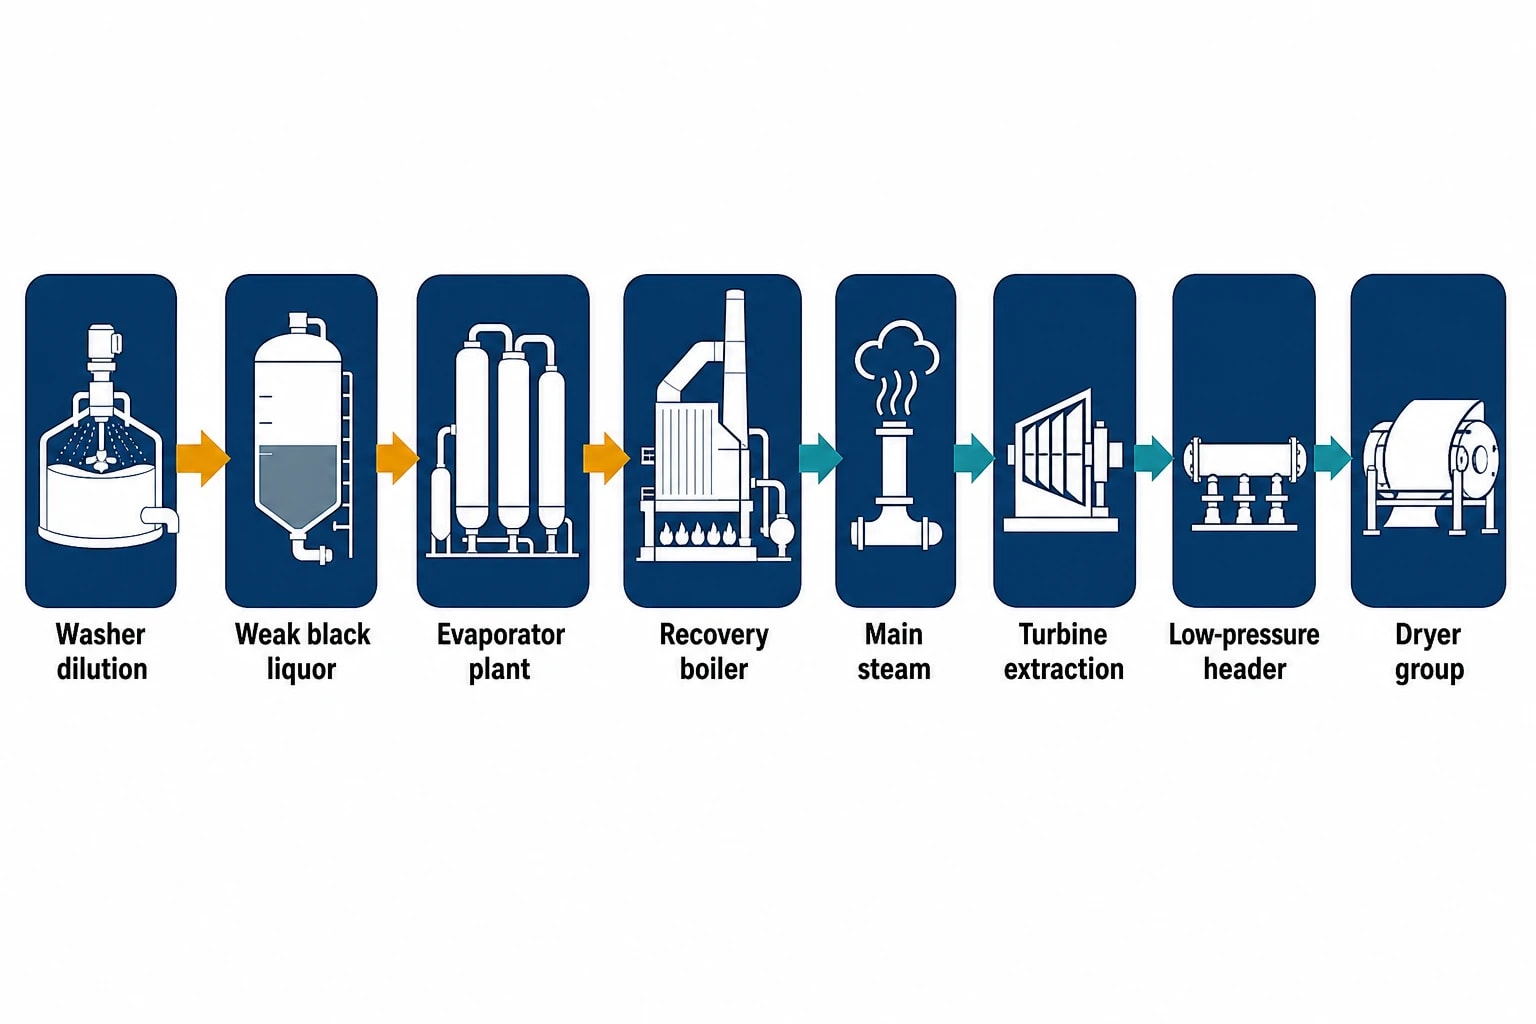
A kraft mill’s steam losses do not respect departmental boundaries. A washer-dilution change can increase weak-black-liquor flow. The evaporator plant then needs more duty. That affects recovery-boiler firing conditions, turbine extraction and the low-pressure header supplying drying.
A model limited to one evaporator effect or one paper-machine dryer group can calculate local duty. It cannot establish the mill-wide consequence of reducing that duty. Aspen Plus pulp and paper simulation needs a boundary that includes the systems producing steam and those determining its final use.
The kraft-mill systems that belong in the steam map
A credible steady-state model normally includes:
- Black-liquor concentration, vapour routing and condensate handling
- Recovery-boiler firing, flue-gas heat recovery and main-steam generation
- Smelt, green liquor and recausticising mass balances
- Steam turbines, extraction points, pressure-reducing stations and desuperheaters
- High-pressure, medium-pressure and low-pressure steam headers
- Boiler-feedwater, deaerator, condensate-return and make-up-water systems
- Pulp dryers or paper-machine cylinder groups, hood air and exhaust
- White-water, filtrate, evaporator-condensate and effluent loops
This boundary assigns each steam stream an origin, pressure level, end use and condensate destination. It prevents a common accounting error: crediting a condensate stream as recovered boiler-feedwater heat while also treating it as available heat for another sink.
Start from a stable operating case
The reference case should represent a defined, stable production period, typically a 24-hour or 72-hour window rather than an annual average assembled from unrelated operating conditions.
Required inputs include pulp production, black-liquor dry solids, recovery-boiler steam generation, header pressures, turbine loading, dryer steam flow, evaporator live steam, condensate flow, fresh-water intake and treated-effluent discharge. Each point needs a timestamp, engineering unit, measurement location and confidence rating.
Field checks matter. A historian tag labelled “LP steam” may sit upstream of a bypass, desuperheater or unmetered branch. Piping and instrumentation diagrams, local valve line-ups and field tracing establish what a meter represents.

Map every energy and material flow in your process with detailed heat and mass balance calculations — the foundation for any optimisation or design project.
Building the Aspen Plus steam balance
Aspen Plus solves mass and energy balances with phase-equilibrium calculations. In a kraft mill, that capability must be applied to reconciled plant data rather than used to fill every gap with assumed values.
Reconcile each steam header separately
Model high-pressure, medium-pressure and low-pressure headers as connected systems. For each header, record generation, turbine extraction, pressure-reducing flows, desuperheating water, process consumers, flash-steam entries, vents and drains.
The first calculation is a header residual. Measured generation minus measured consumption does not automatically equal a physical loss. It can indicate meter bias, inconsistent averaging periods, incorrect pressure assumptions or an unrecorded connection. Reconciliation identifies the most plausible balance; field investigation then assigns a cause.
A 2025 Aspen Plus study at Sappi Kirkniemi paper mill demonstrates the value of this approach. Two pressure-reduction trials lowered the low-pressure network from 2.5 barg to 2.0 barg. The study used Aspen Plus V14 to model the turbine and wider steam balance, rather than treating the header reduction as an isolated dryer adjustment.
Map condensate as carefully as steam
Condensate is an energy stream, a water stream and, depending on contamination, a process-quality issue. The model should distinguish:
- Clean condensate returned to boiler feedwater
- Condensate sent through flash tanks
- Foul evaporator condensate requiring stripping or treatment
- Condensate discharged to sewer
- Blowdown and make-up water
- Flash steam recovered to a lower-pressure consumer or vented
A published paper-machine case illustrates the scale of the mass balance. The machine received 25 t/h of steam at 3 bar and 165 °C, then returned 24 t/h of condensate at 95 °C. That is a 96% condensate return by mass, before allowing for blow-through steam and other system losses. A model should reproduce that difference explicitly rather than assume all supplied steam returns as liquid condensate.
For dryer groups without reliable steam meters, engineers can measure condensate-tank level rise over time, calculate condensate flow and reconcile it against group steam demand under stable conditions. This is often more useful than accepting a dubious flow transmitter.
Dryer-section steam losses become visible at group level
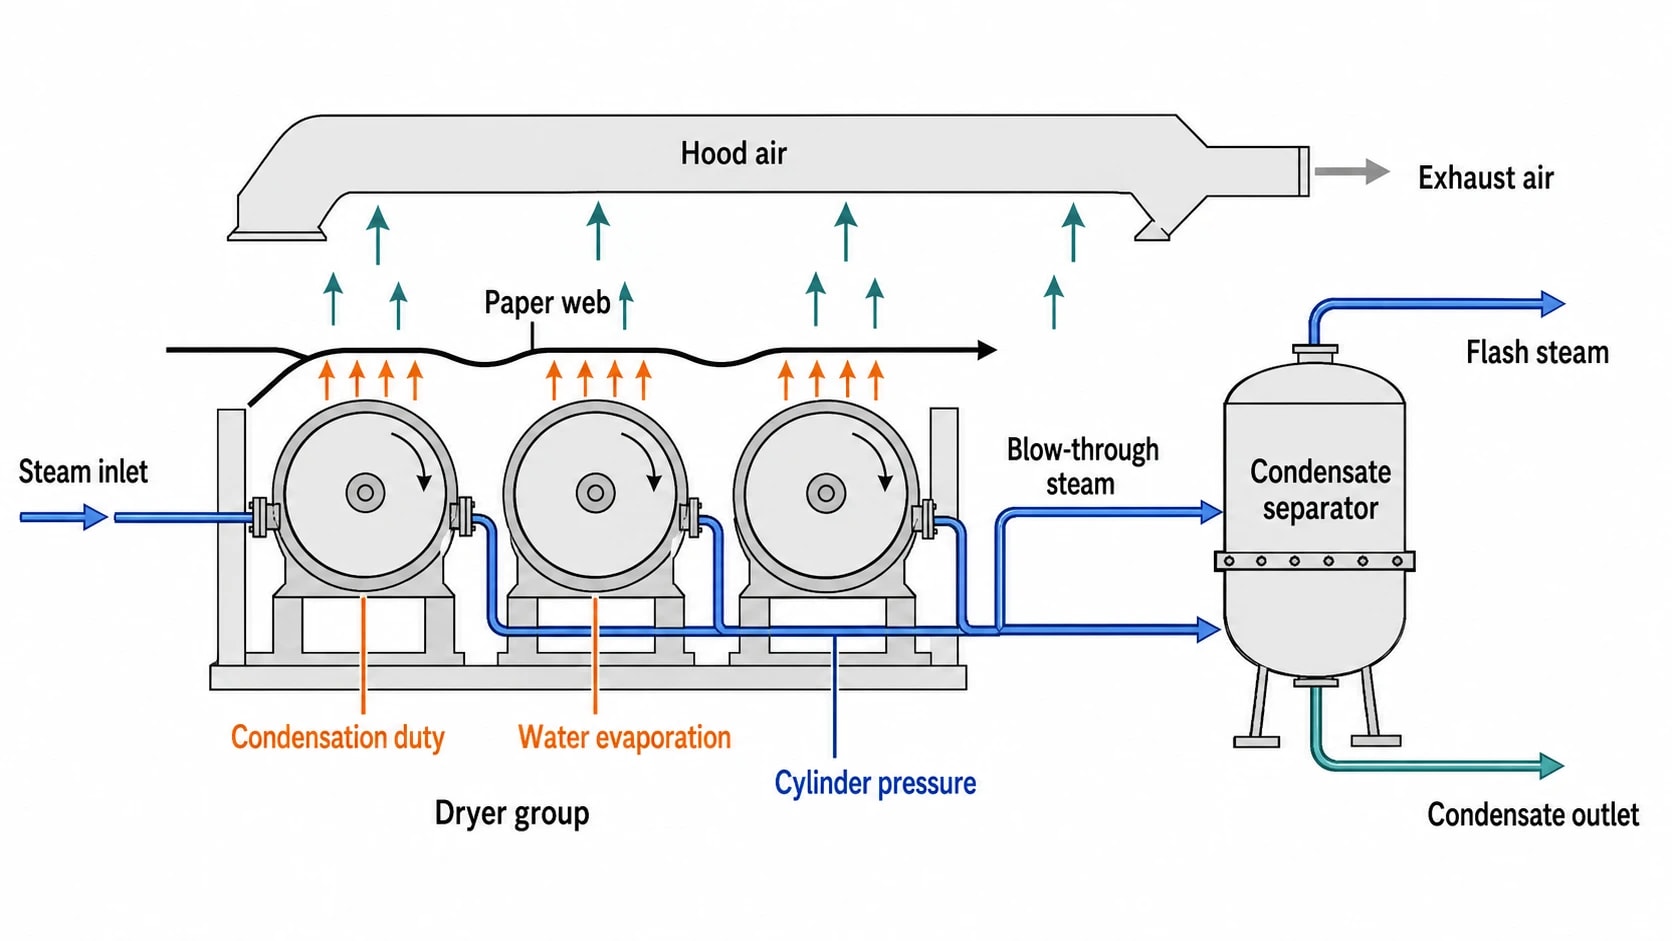
Drying often dominates the low-pressure steam load in integrated pulp and paper mills. A single totaliser hides the pressure, heat-transfer and drainage problems that determine the load.
A measurement study of a 62-cylinder paper-machine dryer section recorded 16.9 to 19.6 t/h of steam, averaging 18.6 t/h, or 1.7 to 1.9 t steam per tonne of paper. Steam pressure across groups ranged from 0.10 bar to 2.65 bar. The figures show why a single pressure target is inadequate. Early and late groups have different temperature requirements and condensate-removal conditions.
What the model should calculate for each group
Each group needs a steam inlet, condensate outlet, blow-through or flash-steam outlet, cylinder pressure, condensate temperature and hood-air duty. The model should report:
- Steam flow and pressure by group
- Condensation duty and implied water evaporation
- Condensate return rate and flash-steam production
- Blow-through steam flow where mechanical drainage requires it
- Hood heating steam and exhaust-air heat loss
- Heat duty per tonne of product at the actual production rate
The result exposes mismatches. A group may receive high-pressure steam to compensate for poor condensate evacuation. Another may consume steam despite cylinder temperatures close to web temperature, contributing little drying duty. A third may need excess hood heating because the air system removes vapour inefficiently.
Quantified dryer-system checks
In the published 62-cylinder study, pre-dryer exhaust flow was calculated at 334,700 m³/h and final-dryer exhaust at 108,600 m³/h. The semi-open hood required 34 kg of dry air to remove each kilogram of water. The study estimated that a closed hood would require 10 kg of dry air per kilogram of water, reducing fan demand and improving heat-recovery conditions.
A separate paper-machine energy case found 7 to 12 psig condensate-removal differential pressure on one machine, compared with 4.2 to 5.1 psig on a similar sister machine. Motive-steam flow was about 20,000 lb/h. Halving that flow released 10,000 lb/h of high-pressure motive steam for other use, while total dryer steam did not fall. The benefit was greater turbine power production, not a reduction in the dryer totaliser.
These examples define the required Aspen Plus output. A proposal to lower group pressure should show the changed steam flow, condensate flow, duty, turbine consequence and sheet-moisture constraint. It should also state whether the saving is fuel, electrical generation, reduced venting or reduced make-up-water heating.
Evaporators and the recovery boiler connect water use to steam demand
Black-liquor evaporation and recovery-boiler performance determine much of a kraft mill’s thermal balance. The model must retain water, organic solids and inorganic species through this part of the flowsheet.
Model evaporator effects, not one black-box duty
For each effect, the model should track weak-liquor flow, dry solids, feed temperature, vapour pressure, live steam, secondary vapour, condensate flow and non-condensable gases. It should test heat-transfer duty against stable operating data before estimating new equipment or altered steam schemes.
A recent linerboard study used a six-effect base case with a steam economy of 5.2 kg of water evaporated per kilogram of live steam. That ratio is a useful validation check only when the effect count, liquor properties, feed solids and vapour-routing arrangement match the mill being modelled.
The steam map should also identify internal bleeds. A kraft-mill integration study reported a 2.6 MW steam bleed from the second evaporator effect to a foul-condensate stripper, replacing low-pressure steam. The number does not justify copying the arrangement elsewhere. It shows the type of site-specific heat source a model can quantify against its effect on evaporation and steam headers.
Link recovery-boiler steam to recovery chemistry
The recovery boiler cannot be represented solely as a steam generator. Black-liquor combustion, smelt formation, reduction efficiency, flue-gas composition and steam production are coupled.
A 2020 Journal of Cleaner Production study built an Aspen Plus recovery-boiler model that predicted green-steam generation and smelt composition simultaneously. It used free-energy minimisation to calculate combustion products, flue gas and smelt composition. That method supports species-level modelling of sodium, sulphur, carbon, hydrogen, oxygen and potassium where recovery chemistry affects the mill balance.
The model should validate recovery-boiler steam flow, main-steam pressure and temperature, black-liquor dry solids, flue-gas oxygen and smelt composition against site measurements. Boiler operating limits and recovery chemistry remain the governing constraints for any operating change.
Map every energy and material flow in your process with detailed heat and mass balance calculations — the foundation for any optimisation or design project.
Use water-loop closure to test the steam-loss map
Water balance provides an independent check on energy results. Water entering with fresh make-up, washer dilution, white water and filtrates must leave as product moisture, vapour, condensate, effluent or another defined stream.
Commission Implementing Decision 2014/687/EU gives annual treated-effluent reference flows of 25 to 50 m³/ADt for bleached kraft and 15 to 40 m³/ADt for unbleached kraft. These are BAT-associated ranges, not universal site targets. Grade, mill configuration, permit conditions and effluent-treatment design affect the applicable result.
Model quality constraints alongside energy
Under BAT 5, water-circuit closure should go as far as is technically feasible. It also recognises water-quality and product-quality constraints, precipitation, incrustation and odour as potential limits.
A model therefore needs defined water loops for white water, bleach-plant filtrate, clean evaporator condensate, foul condensate, cooling water, seal water and sewer. A warm stream may reduce make-up-water heating, but dissolved solids, methanol, sulphur compounds or fibre carryover can prevent direct reuse.
The final water balance should reconcile fresh-water intake, treated effluent, product moisture, evaporation and condensate return on the same air-dried tonne basis used for steam.
Test steam-reduction cases and report the result in mill terms
The model becomes useful when it turns a suspected loss into a testable operating case with a measured baseline and quantified outcome.
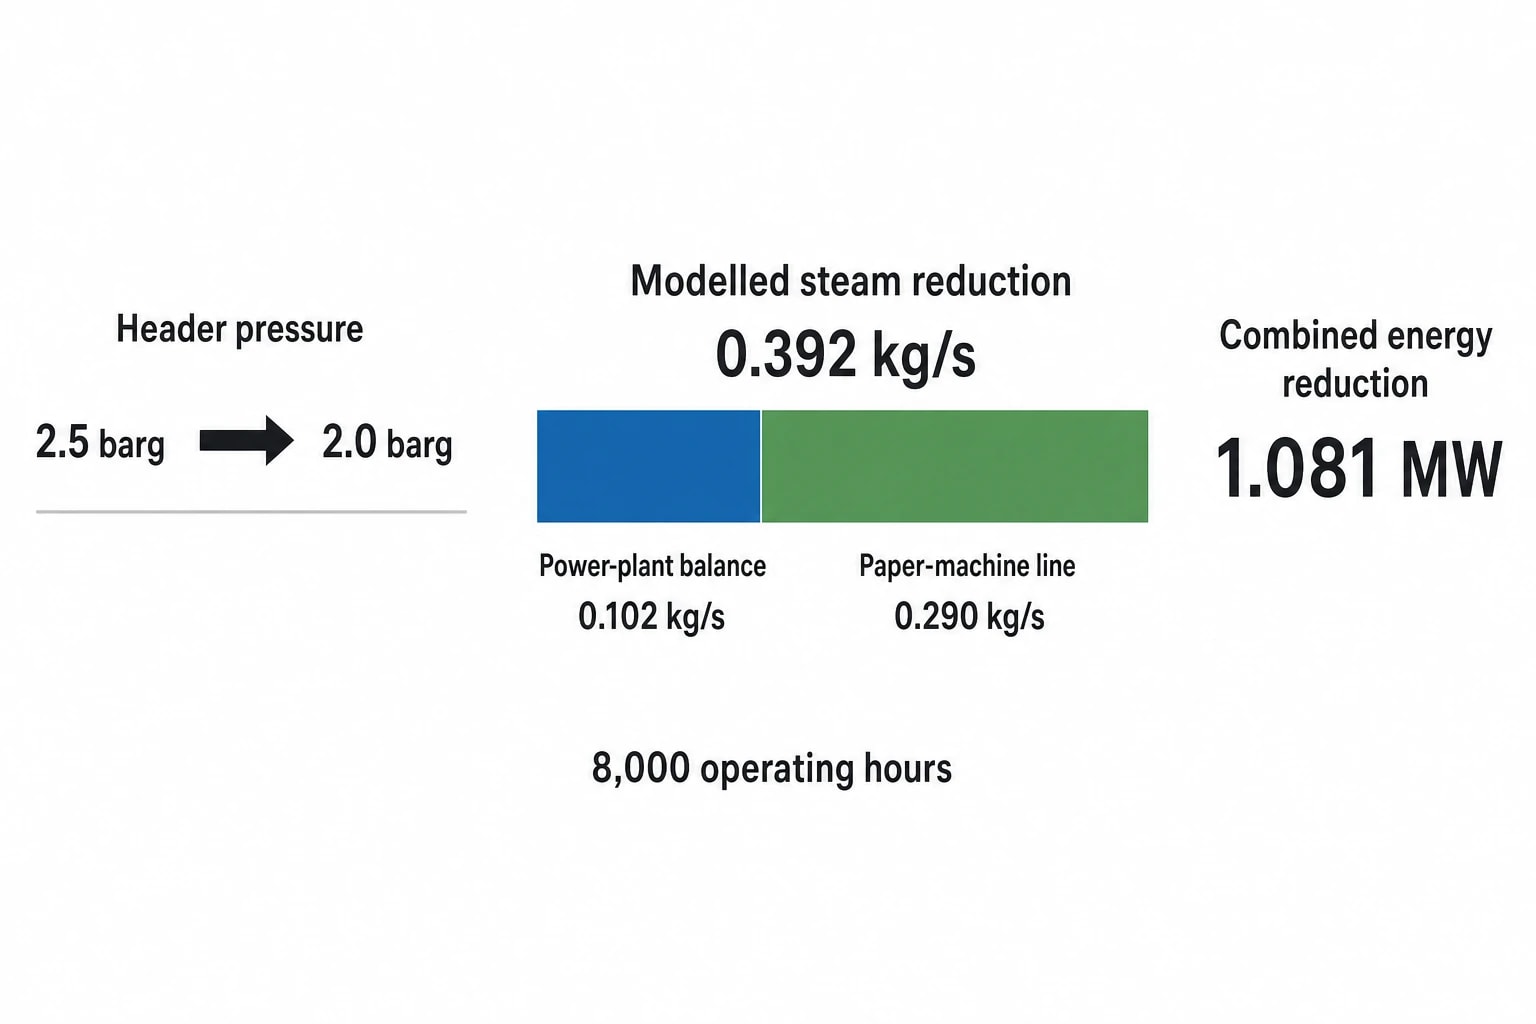
The Sappi Kirkniemi Aspen Plus study provides a useful reporting format. Reducing low-pressure steam from 2.5 barg to 2.0 barg produced a modelled combined reduction of 0.392 kg/s of steam, equivalent to 1.081 MW, across the power plant and one paper-machine line. The analysis separated 0.102 kg/s from the power-plant balance and 0.290 kg/s from the paper-machine result.
The study modelled this result over 8,000 annual operating hours, then identified an operational constraint: one machine’s drying groups required higher pressure for some grades. Its authors concluded that the full pressure reduction required steam-network investment and further trials. That qualification is as important as the calculated saving.
A practical Aspen Plus case register
| Case | Baseline and modelled change | Required proof before implementation |
|---|---|---|
| Header-pressure matching | Reduce a defined low-pressure header from 2.5 barg to 2.0 barg, reporting steam-flow, turbine and dryer-duty changes | Grade-by-grade dryer pressure requirement, sheet moisture and condensate drainage |
| Dryer condensate improvement | Compare measured steam flow with condensate return, such as 25 t/h steam and 24 t/h condensate | Flash-tank pressure, blow-through flow, contamination and return-pump capacity |
| Evaporator steam substitution | Replace a measured low-pressure consumer with an internal vapour bleed, such as a 2.6 MW second-effect bleed | Effect temperatures, liquor solids, stripper duty and non-condensable-gas handling |
| Hood heat recovery | Test heat available from actual exhaust temperature, humidity and flow against a defined water or air sink | Seasonal sink availability, fouling risk, corrosion and maintenance access |
| Recovery-boiler change | Test black-liquor solids or air-distribution cases against steam generation and chemical-recovery balance | Furnace limits, emissions, smelt chemistry and boiler-operating procedures |
Each case should include a baseline period, production rate, fuel mix, steam enthalpy basis, affected header, condensate consequence, carbon factor and implementation constraint. Combining cases before testing them separately risks claiming the same steam saving twice.
What a credible steam-loss map delivers
A credible Aspen Plus pulp and paper simulation delivers a reconciled explanation of steam generation, pressure level, end use, condensate recovery, heat rejection and water movement across the kraft mill.
Its final package should include a single-source-of-truth process flow diagram, embedded stream tables, reconciled mass and energy balances, operating-case comparisons and a ranked register of opportunities. A Sankey energy map can communicate the result, but the underlying stream data must remain available for engineering review.
The objective is a practical energy-reduction roadmap. Each proposed change needs a quantified thermal effect, a defined operating constraint and a clear route to field verification. That is how a mill converts scattered flow, pressure and temperature measurements into decisions that improve steam use without compromising recovery chemistry, production or product quality.
This article reflects the independent analysis and editorial opinion of EnerTherm Engineering. Product names, trademarks, and brands mentioned belong to their respective owners. EnerTherm Engineering is not affiliated with, endorsed by, or a licensee of any third-party software or product mentioned unless explicitly stated.

Managing Director — EnerTherm Engineering
Dr. François Pierrel is Managing Director of EnerTherm Engineering with over two decades of expertise in thermal design, heat transfer, and industrial energy optimisation. He holds a PhD in Heat Transfer from Cranfield University and a Post-Doctorate from Heriot-Watt University.
