Automating EU ETS Audits to Cut Costs by 15-25%
Real-time, read-only meter data replaces manual spreadsheets for SECR audits.
The European Commission's decision to contract the EU Emissions Trading System (EU ETS) Phase 4 carbon cap by an additional 27 million allowances in 2026 has increased the financial pressure on energy-intensive industrial facilities. With the annual linear reduction factor set at 4.3 per cent, industrial manufacturers face a rapidly shrinking pool of free allocations and escalating compliance penalties. For Environmental, Health and Safety (EHS) managers, compliance is no longer a routine administrative task but a major financial variable that directly affects the bottom line.
Many industrial sites still manage their annual emissions data using manual, spreadsheet-based collection methods. EHS teams spend weeks extracting utility data from physical meters, reading paper billing statements and manually entering figures into complex master sheets. This fragmented process introduces severe administrative overhead and exposes the facility to operational and financial risk during annual third-party audits.
The Regulatory Friction of Manual Emissions Auditing
The Cost of Administrative Overhead in Industrial Emissions Monitoring Systems
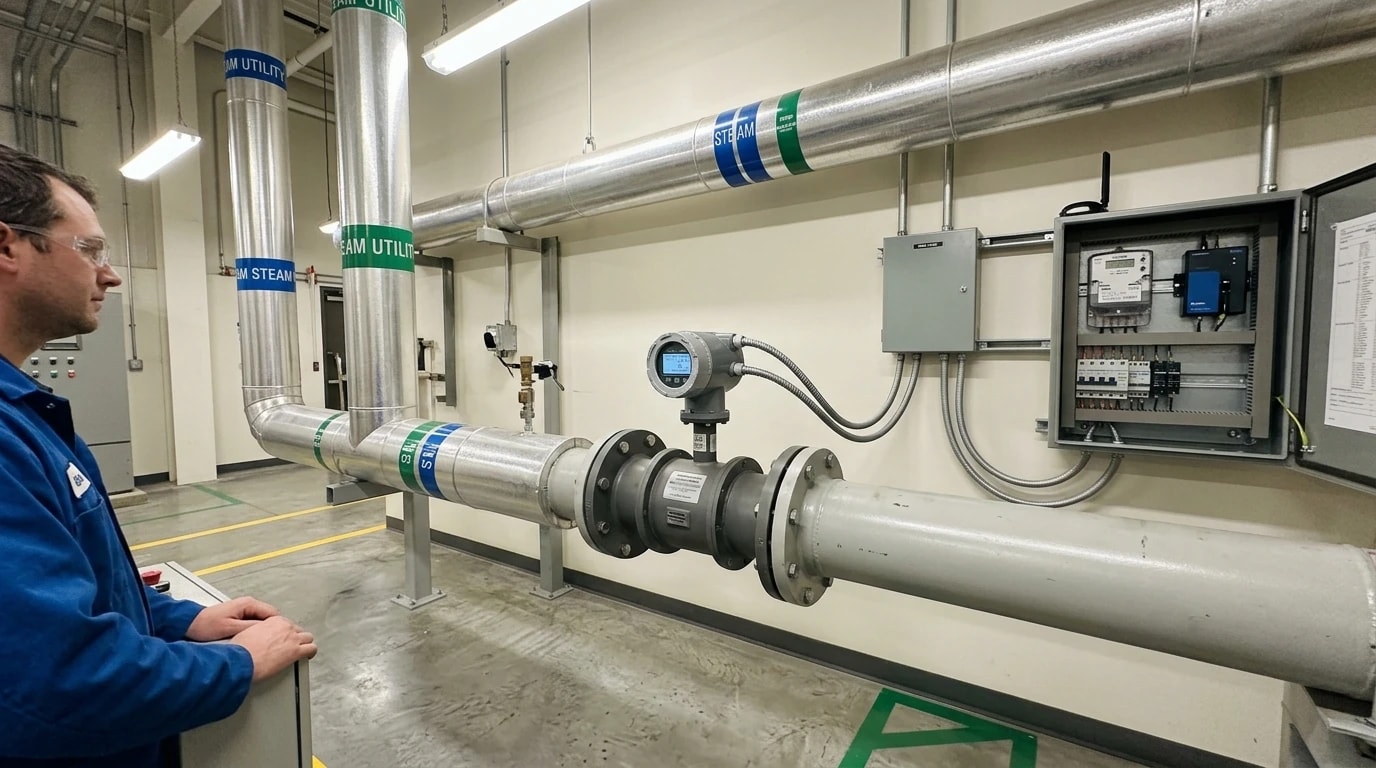
Large-scale manufacturing sites in the chemical, pharmaceutical and food and beverage sectors operate with substantial utility overheads. For these organisations, compliance with international carbon reporting schemes has become a major administrative burden. EHS managers often rely on fragmented, legacy procedures to collect energy consumption data. When administrative teams spend weeks collecting physical utility invoices, checking meter dials and compiling spreadsheet records, they divert valuable resources from active energy-reduction projects. The administrative cost of managing manual data collection pathways frequently offsets the potential savings gained from efficiency improvements.
Manual Data Gaps and Human Error in Emissions Tracking
Manual data transcription introduces systematic vulnerabilities into corporate carbon reporting. Environmental managers must compile records from dozens of disparate meters, each measuring different units, such as cubic metres, kilowatt hours or tonnes of steam. Transposing these figures into master spreadsheets creates multiple opportunities for human error. A single misplaced decimal point or an outdated carbon conversion factor can corrupt an entire annual report. Furthermore, manual tracking creates data gaps when meters are missed during routine manual rounds. These data gaps force companies to rely on conservative estimation techniques, which competent authorities penalise with higher emissions assignments.

Omni Vision delivers turnkey utility metering, CO2 tracking, and AI-powered production KPI intelligence — giving you real-time dashboards and actionable insights across your entire facility.
The Cost Structure of Third-Party Verification in the EU ETS
Auditor Verification Prep and Materially Thresholds
Under Phase 4 of the EU Emissions Trading System (EU ETS), all annual emissions reports must undergo independent verification by an accredited third-party verifier before the mandatory 31 March submission deadline. Third-party verification is a comprehensive technical audit. Verifiers apply strict risk-based assessments and materiality thresholds to identify misstatements in the reported data. When verifiers encounter manual spreadsheets, they must conduct extensive sampling and trace individual entries back to raw invoices or manual logbooks. This manual data tracing extends the duration of the audit, which significantly increases verification fees.
The Risk of Registry Account Freezing and Missed Deadlines
Failing to submit a verified emissions report by the annual deadline carries severe consequences. National competent authorities will freeze the operator's registry account. A frozen account prevents the facility from surrendering EU Allowances (EUAs) by the statutory 30 September deadline. Under the EU ETS Directive, the penalty for failing to surrender sufficient allowances is €100 per tonne of CO₂e emitted, which is adjusted annually for inflation, in addition to the requirement to purchase and surrender the missing allowances. This massive financial risk makes the efficiency of the annual audit a critical operational priority.
The Architecture of Modern Industrial Emissions Monitoring Systems
Secure Read-Only Data Ingestion
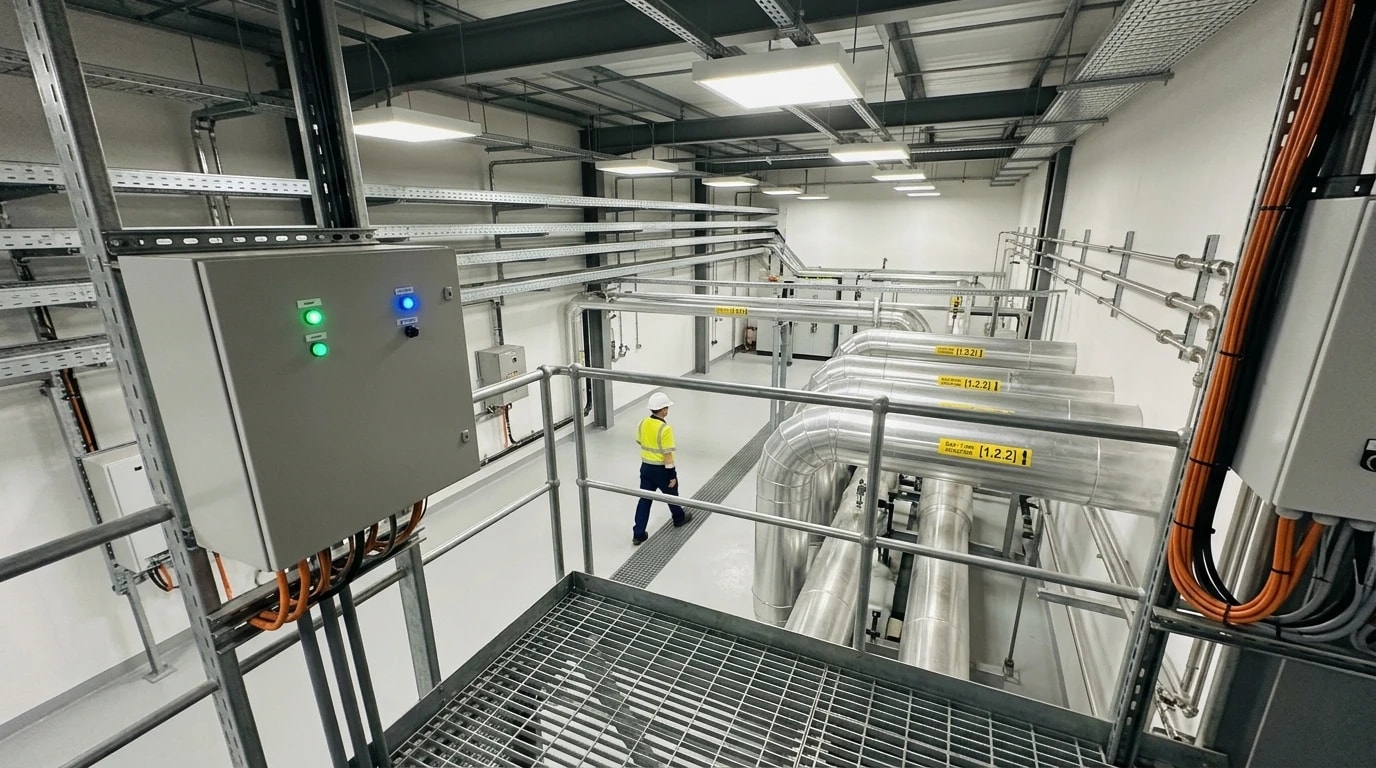
Modern industrial emissions monitoring systems eliminate the administrative overhead and risk of manual tracking by automating data collection directly from the plant floor. The Omni Vision Energy Intelligence Platform integrates precision hardware with existing industrial infrastructure to establish a continuous, secure data flow. The communication hardware connects directly to existing Programmable Logic Controllers (PLCs) and field instruments without requiring modifications to the operational control code.
To ensure compliance with strict safety and quality standards, such as Good Manufacturing Practice (GMP) in pharmaceutical processing and Hazard Analysis Critical Control Point (HACCP) in food and beverage plants, the system utilises a read-only architecture. The hardware extracts telemetry but lacks any write-back access, protecting the operational integrity of the plant. The data is pushed to the cloud using a secure, one-way encrypted push protocol. Process networks commonly communicate via standard open protocols, including:
- Modbus: For legacy meter integration.
- OPC-UA: For secure, platform-independent machine-to-machine communication.
- BACnet: For building automation and HVAC systems.
- MQTT: For lightweight, high-frequency IoT data transport.
Monitoring Six Core Utility Streams
To compile a complete and auditable carbon footprint, the platform continuously monitors six core utility streams:
- Electricity: Active power, reactive power, power factor and voltage.
- Natural Gas: Volumetric flow rate, temperature and cumulative volume.
- Water: Consumption rates and supply temperature.
- Steam: Mass flow rate, pressure and thermal energy content.
- Compressed Air: System pressure, volumetric flow and compressor power consumption.
- Fuel Oil: Accurate flow metrics for backup generators and boilers.
This granular, high-frequency metering creates an unalterable digital ledger of utility consumption, providing a secure foundation for automated emissions reporting.

Track energy consumption, emissions, and process parameters with seamless PLC/SCADA integration via Modbus, OPC-UA, and MQTT protocols.
Aligning with the EU ETS Monitoring and Reporting Regulation (MRR)
Understanding Tier-Based Reporting and Uncertainty Thresholds
Compliance with the EU ETS is governed by the Monitoring and Reporting Regulation (MRR), specifically Commission Implementing Regulation (EU) 2018/2066. The MRR requires industrial operators to define a formal Monitoring Plan that specifies how emissions from every source stream are monitored, calculated or measured. The regulation establishes a hierarchical tier system to classify data accuracy. Higher tiers represent more accurate measurement methods but require lower maximum uncertainty thresholds.
For major fuel streams in category C installations, operators must achieve Tier 4 for activity data, which mandates a maximum uncertainty of ±1.5 per cent at a 95 per cent confidence level. Proving this level of accuracy with manual records is exceptionally difficult because operators must compile exhaustive uncertainty assessments that calculate the combined impact of meter tolerances, calibration drift and reading frequency. Modern industrial emissions monitoring systems solve this challenge by recording continuous, high-frequency digital telemetry directly from calibrated meters. This automated collection limits the cumulative uncertainty in the annual monitoring plan, ensuring that the facility consistently satisfies its required regulatory tier.
| Source Stream Classification | Target Tier | Maximum Allowed Uncertainty (95% Confidence) | Data Collection Method |
|---|---|---|---|
| Category A (Low Emissions) | Tier 1 / 2 | ±7.5 to ±5.0 per cent | Manual Invoices & Meter Logs |
| Category B (Medium Emissions) | Tier 3 | ±2.5 per cent | Automated Metering / SCADA |
| Category C (High Emissions) | Tier 4 | ±1.5 per cent | Continuous Automated Ingestion |
Eliminating Fallback Approaches and "Unreasonable Costs" Derogations
When a facility cannot meet its required tier due to inadequate instrumentation, the operator must adopt a fallback approach. Fallback approaches require an annual update of the uncertainty analysis during third-party verification, which increases compliance costs and auditor scrutiny. To bypass a higher tier, the operator must submit a detailed unreasonable costs assessment to the competent authority, proving that the financial cost of installing a compliant meter exceeds the regulatory benefit. Managing these annual derogations requires significant administrative effort and consultant fees. Installing automated, non-invasive metering systems bypasses this administrative cycle entirely by delivering compliant, high-tier data directly to the cloud.
Bridging ISO 14064-1:2018 and UK SECR Frameworks
Delivering Verifiable Evidence under ISO 14064-1:2018
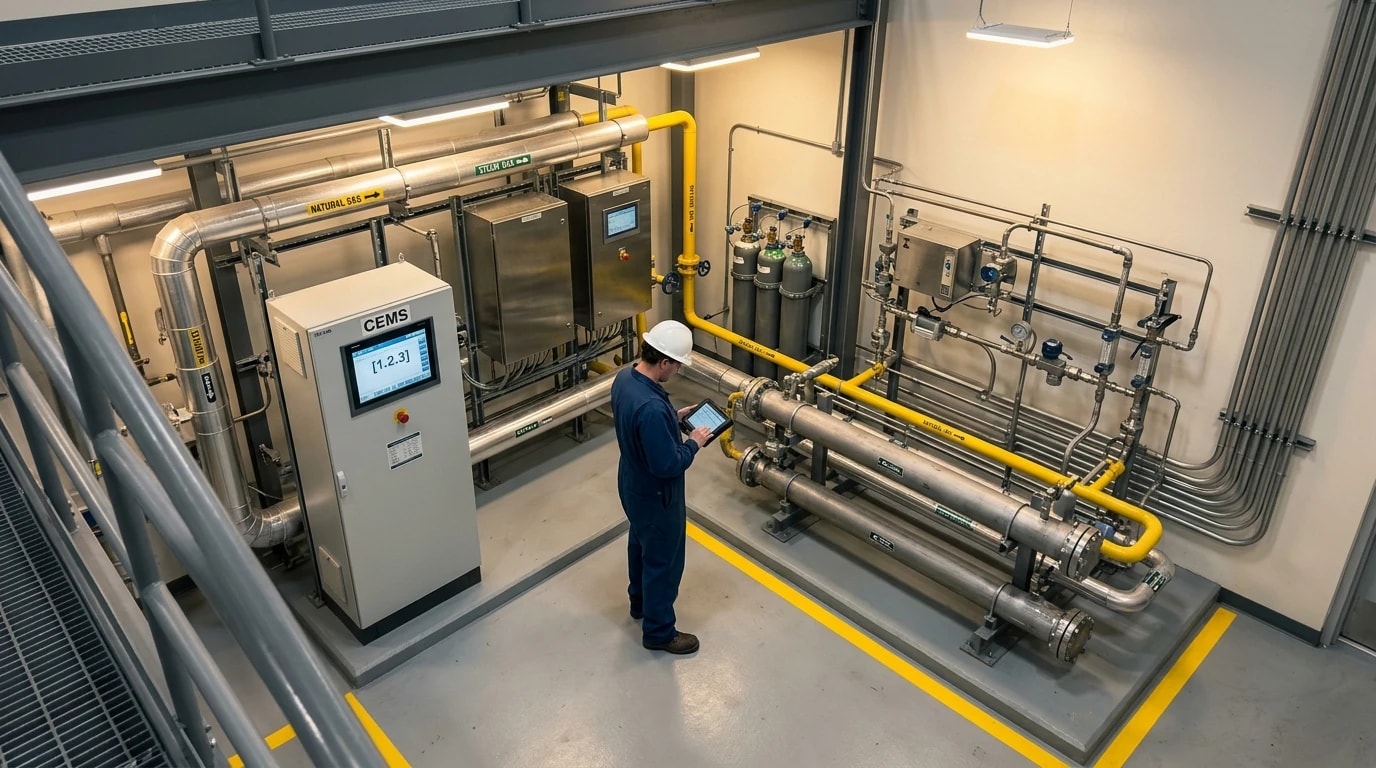
Industrial corporations often report emissions under the ISO 14064-1:2018 standard, which defines requirements for quantifying and reporting greenhouse gas emissions and removals at the organisation level. A critical requirement of ISO 14064-1:2018 is that all reported data must be supported by verifiable evidence. Third-party auditors conducting ISO verifications look for clear, transparent data lineages.
Manual spreadsheets are classified by auditors as low-quality, high-risk data sources because they are highly susceptible to accidental data overwriting or formula corruption. If an auditor identifies these issues, they must expand their sample sizes, increasing the duration and cost of the audit. Automated meter-to-cloud data ingestion provides an unalterable digital trail. This raw-data pedigree satisfies the strict verification criteria of ISO 14064-1:2018, allowing auditors to verify the corporate inventory quickly and cost-effectively.
Automating SECR Scope 1 and Scope 2 Intensity Ratios
In the UK, the Streamlined Energy and Carbon Reporting (SECR) regulations require approximately 11,900 large UK companies and LLPs to disclose their energy use and carbon emissions annually. SECR is mandatory for unquoted UK companies that exceed at least two of the following thresholds:
- An annual turnover of £36 million or more.
- A balance sheet total of £18 million or more.
- 250 or more employees.
These organisations must disclose their annual UK energy consumption, associated Scope 1 (direct) emissions and Scope 2 (indirect) emissions within their annual directors' report. Furthermore, SECR mandates the disclosure of at least one intensity ratio, which compares emissions against a relevant business activity metric.
Traditional reporting systems calculate intensity ratios retrospectively, dividing total annual emissions by annual production tonnage at the end of the year. This delayed method provides zero opportunity for operational correction. Modern industrial emissions monitoring systems integrate live production volumes directly from the plant's PLC networks to calculate real-time intensity ratios. For instance, a pharmaceutical facility can monitor the precise kilograms of CO₂e emitted per batch of medicine, while a food manufacturer tracks emissions per tonne of product. This real-time correlation converts SECR from a passive reporting obligation into an active tool for carbon reduction.
Delivering 15-25% Cost Reductions and Fast ROI
Quantifying the Administrative Savings
Transitioning from manual data collection to automated compliance management delivers immediate financial benefits. EHS teams, sustainability officers and operations managers spend weeks preparing for the annual verification period. Automated compliance management cuts the administrative time required for audit preparation by up to 80 per cent.
Because the data is stored in a clean, structured and unalterable cloud database, accredited third-party verifiers can complete their risk assessments and materiality checks far more efficiently. This direct reduction in audit friction can lower annual third-party verification fees by 15 to 25 per cent, transforming a tedious annual compliance cycle into a rapid, low-friction administrative process.
EPSA Cloud Intelligence and Energy Waste Anomaly Detection
The largest financial savings, however, come from direct utility cost reductions enabled by EPSA Cloud Intelligence. The platform uses AI-driven anomaly detection to identify operational waste in real time. Rather than waiting for a monthly billing cycle or an annual carbon audit to discover inefficiencies, plant engineers receive proactive alerts.
The platform continuously monitors utility streams to identify subtle performance drifts:
- Compressed Air Optimisation: The platform detects pressure drops across clogged inline filters. Resolving these localised drop points allows operators to safely reduce the main compressor discharge pressure. For every 1 bar reduction in system discharge pressure, total compressor electricity consumption drops by 7 per cent.
- Steam System Efficiency: In chemical and pharmaceutical manufacturing, steam traps and valves frequently fail open, leading to massive energy losses. The platform correlates steam mass flow with production schedules to identify anomalous consumption during idle periods.
- Batch-Level Cost Mapping: By mapping energy consumption directly to production batches, process engineers can identify exactly why specific batches consume more energy than others, allowing for immediate process adjustments.
These combined insights systematically enable operators to achieve 15 to 25 per cent energy cost reductions across the facility.
Turnkey 8-to-16 Week Deployment Model
The Omni Vision platform utilises a standardised 8 to 16 week turnkey deployment model that ensures a rapid path to compliance and efficiency. EnerTherm Engineering's technical deployment specialists integrate the non-invasive, read-only hardware with existing PLC networks, and the EPSA Cloud Intelligence engine begins analysing telemetry immediately. Backed by a 12-year track record and over 150 industrial customers, this automated approach delivers an operational ROI in less than 12 months.
This article reflects the independent analysis and editorial opinion of EnerTherm Engineering. Product names, trademarks, and brands mentioned belong to their respective owners. EnerTherm Engineering is not affiliated with, endorsed by, or a licensee of any third-party software or product mentioned unless explicitly stated.

Technical Manager — EnerTherm Engineering
John Naranjo is Technical Manager at EnerTherm Engineering, bringing specialist expertise in chemical and environmental engineering. He recently led the implementation of Omni Vision, EnerTherm's real-time energy and utility monitoring platform. He holds an MSc in Environmental Engineering from the University of Huelva and a BSc in Chemical Engineering, with memberships in both the Energy Institute and IChemE.
