Crude Assay Data Analysis for Reliable CDU Models
How TBP, density and sulphur data shape pseudo-component slates for CDU simulation.
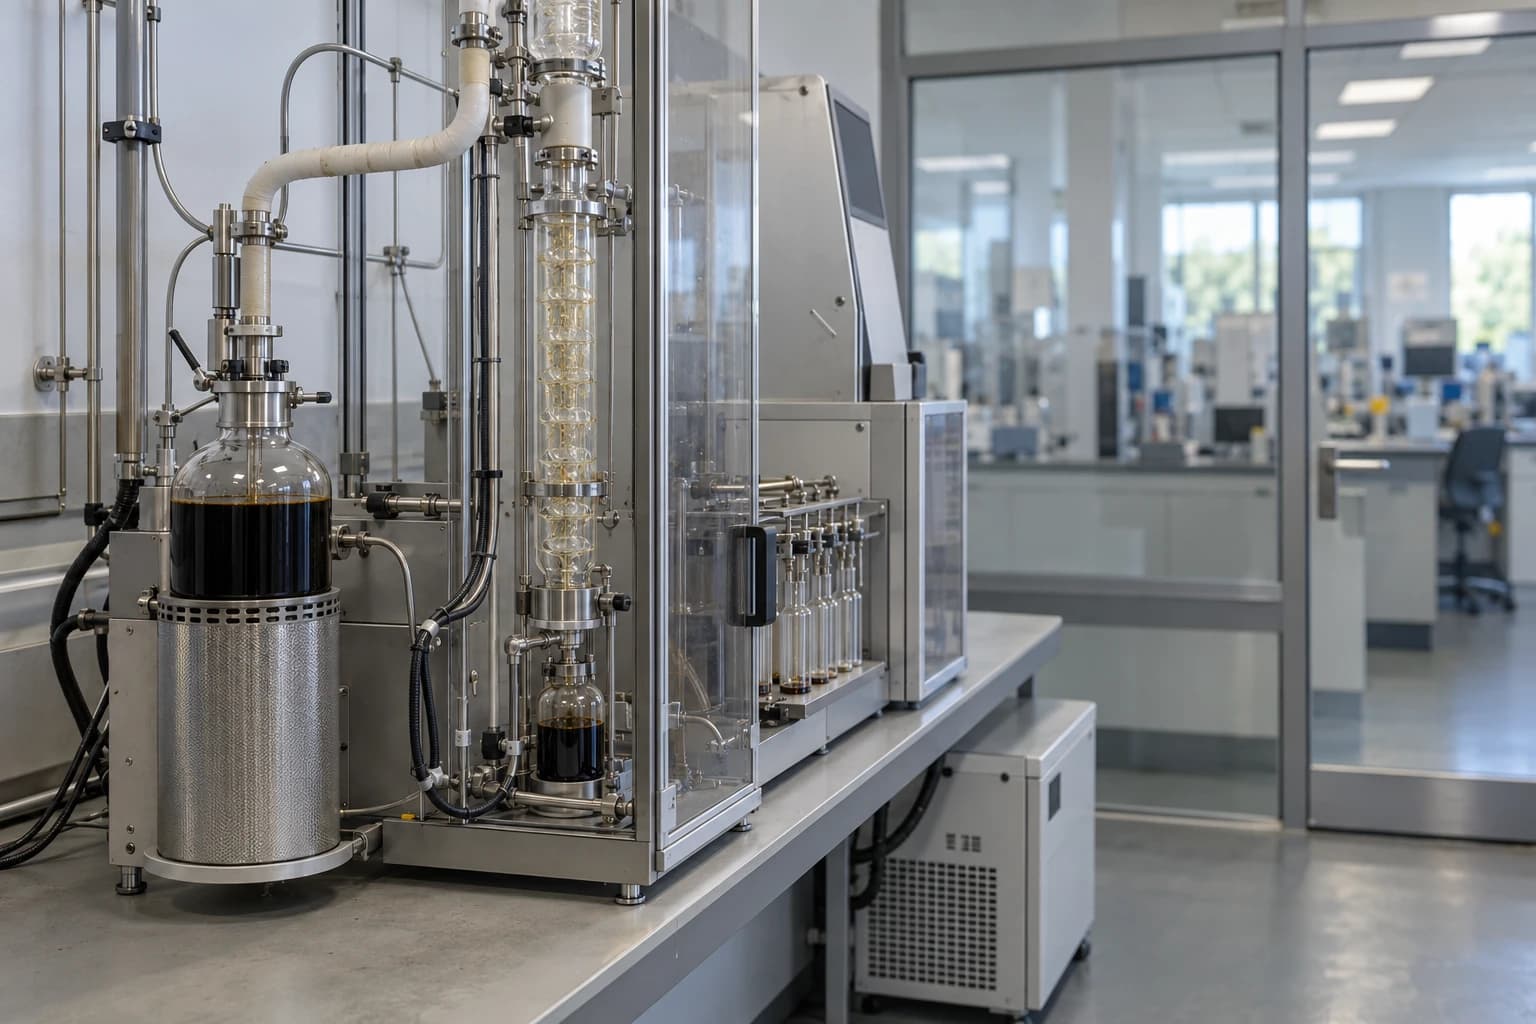
Crude assay data analysis is the controlled conversion of measured crude-oil distillation, density, sulphur and fraction-property data into pseudo-components that represent the feed in a crude distillation unit model. ASTM D2892-25 defines TBP distillation of stabilised crude to a final cut temperature of 400 °C atmospheric-equivalent temperature, using a 14- to 18-theoretical-plate column at a 5:1 reflux ratio.
That laboratory basis matters. A CDU simulation can converge while predicting the wrong naphtha, kerosene, diesel or atmospheric-residue yield because its pseudo-component slate does not reproduce the crude. The error often begins before column specifications are entered: mixed mass and volume bases, incomplete light-end treatment, an untested TBP curve or heavy fractions compressed into an unsuitable residue representation.
For refinery process engineers, crude assay data analysis creates the feed description from which CDU yields, draw properties, flash-zone conditions and heat duties are calculated. The work requires a traceable chain from laboratory measurement to fitted pseudo-component properties and plant validation.
Why crude assay data analysis controls CDU model reliability
A crude oil is a continuous mixture of hydrocarbons and non-hydrocarbon compounds. Its composition ranges from dissolved gases and light naphtha to high-boiling atmospheric residue. A process simulator cannot represent each molecular species in that mixture, so it groups material into pseudo-components.
Each pseudo-component represents a boiling range and carries calculated or measured properties that affect phase equilibrium, enthalpy, density and product quality. The quality of this representation determines whether a CDU model can support yield prediction and operating analysis.
The pseudo-component slate is the CDU feed specification
The crude assay establishes how much material lies below or above each boiling temperature. The pseudo-component slate translates that curve into discrete material that the CDU model can separate through the atmospheric column.
A model uses the slate to calculate:
- Product yield against refinery draw cutpoints.
- Product density and boiling behaviour.
- Internal vapour and liquid traffic.
- Flash-zone conditions.
- Furnace and preheat-train duty.
- Atmospheric-residue quantity and properties.
A numerical solution only confirms that the selected equations have converged. It does not confirm that the calculated feed resembles the crude in the tank.
Cutpoint uncertainty has a direct yield consequence
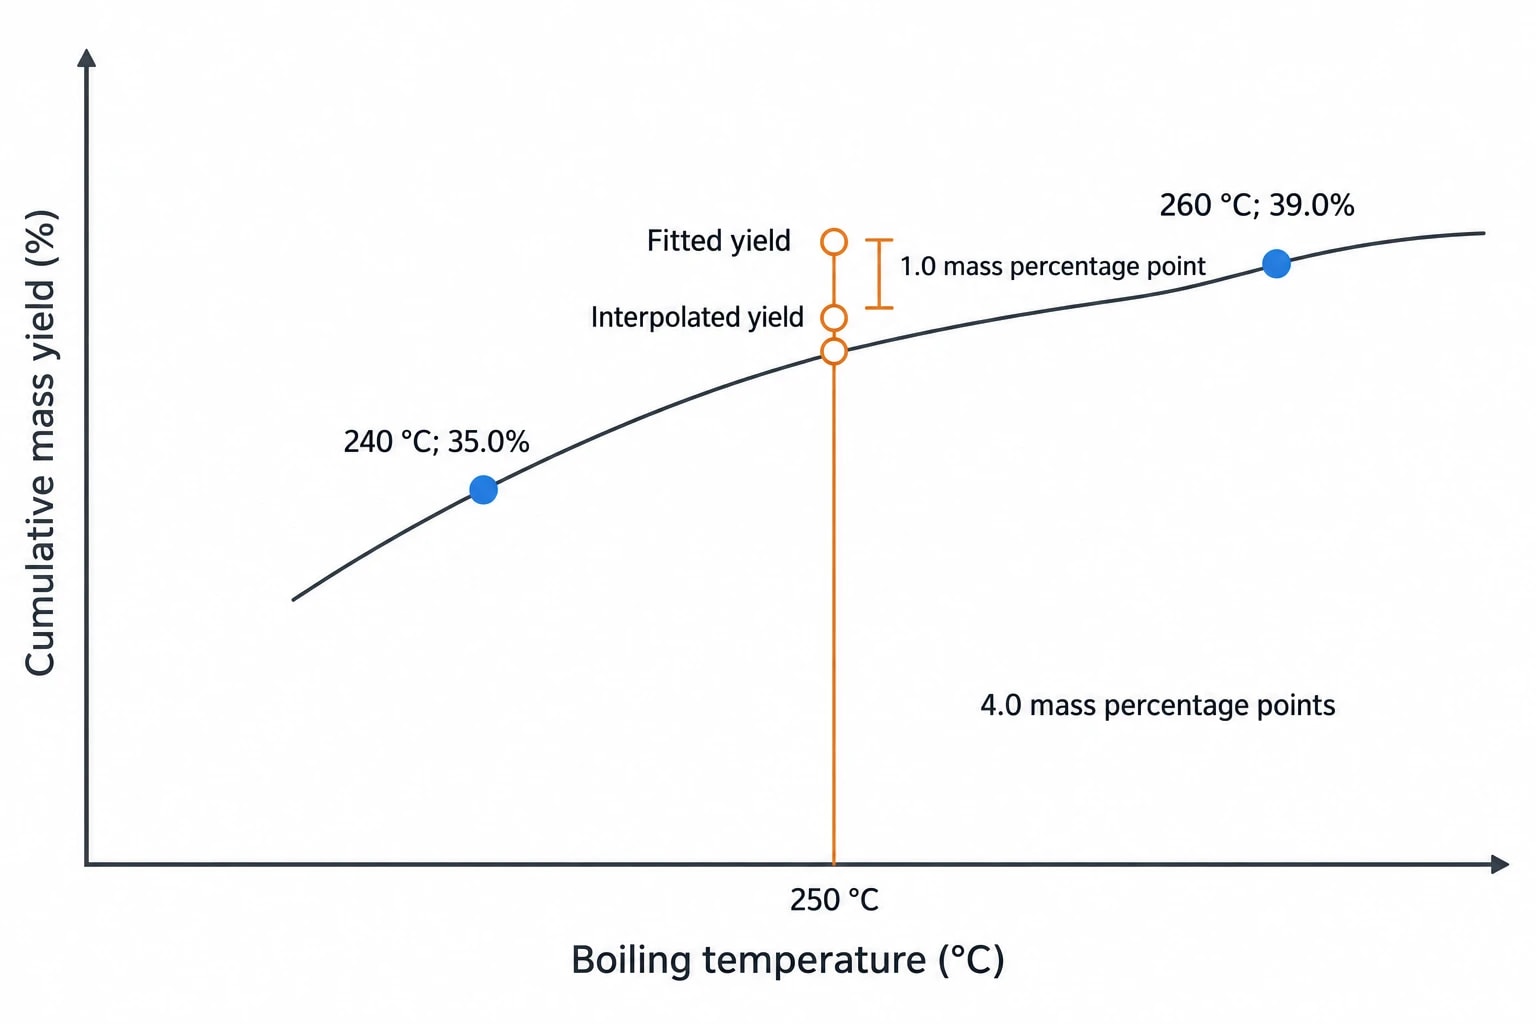
Assay spacing defines the resolution available to the model. Consider a TBP curve with measured cumulative mass yields of 35.0% at 240 °C and 39.0% at 260 °C. A 250 °C product boundary lies inside a 4.0 mass-percentage-point interval and requires interpolation.
If the fitted cumulative yield at 250 °C differs from the best assay interpretation by 1.0 mass percentage point, the model assigns 1.0 mass percentage point too much or too little material below that cutpoint. The error then appears in the predicted split between adjacent CDU products. The issue is material even where total feed closure remains perfect.
Refineries should distinguish a measured cutpoint from an interpolated one. A model may use interpolation, but its documentation should show the bracketing assay points and any sensitivity case used to test the resulting yield uncertainty.

Map every energy and material flow in your process with detailed heat and mass balance calculations — the foundation for any optimisation or design project.
Establishing a defensible TBP curve
The true boiling point curve provides the organising structure for crude assay data analysis. It links cumulative recovery with boiling temperature and supplies the boiling-range distribution from which pseudo-components are created.
Use the ASTM D2892-25 laboratory basis correctly
ASTM D2892-25 applies to stabilised crude petroleum and produces standardised liquefied-gas, distillate and residuum fractions for analysis. The method reports yields by mass and volume, with the 15/5 laboratory basis providing the TBP reference.
Before fitting a curve, engineers should establish:
- The assay method and whether the temperature basis is atmospheric equivalent.
- The feed condition, including stabilisation and water handling.
- Reported mass, volume and density bases.
- Fraction cut temperatures, individual yields and cumulative yields.
- The reference temperature for density data.
- The treatment of gas, losses and residue.
- The analytical basis for whole-crude and fraction sulphur.
A certificate of quality and a full crude assay serve different purposes. The former may provide whole-crude density, sulphur and selected distillation points. The latter may include fraction yields, densities, sulphur and heavy-end measurements. A model can use either source, but its uncertainty must reflect the available evidence.
Test curve integrity before pseudo-component fitting
A valid cumulative TBP curve should increase continuously with recovery. Individual fraction yields should be positive, and reported fractions, residue and explicit losses should close to the assay feed basis.
Engineers should investigate abrupt slope changes before treating them as genuine crude behaviour. The cause may be a change of distillation method, a transcription issue, a missing fraction or a conversion from volume to mass made with unsuitable density data.
The 400 °C atmospheric-equivalent endpoint needs clear treatment. It marks the scope of the D2892 distillation, not the end of the crude. The remaining material requires residue characterisation suitable for the study. One atmospheric-residue pseudo-component may be sufficient for a broad yield estimate, while a vacuum-unit study normally needs a more resolved heavy-end representation.
Reconciling mass and volume yield bases
Mass yield provides the primary basis for material-balance closure. Volume yield remains important because refinery production and planning commonly compare products on a volume basis. Crude assay data analysis must retain both without blending them carelessly.
Apply the API conversion procedure
API Technical Report TDB-3:2026-01, Technical Data Book: Chapter 3 - Petroleum Fraction Distillation Interconversions, provides a documented reference for distillation-curve interconversions. Its Procedure 3B1.1, covering conversion of a weight-basis distillation curve to a volume basis, addresses the use case directly relevant to CDU assay reconstruction.
The procedure supports back-blending fractionation products on a common basis to estimate feed distillation curves, cutpoints and yields. That differs from multiplying the whole-crude mass flow by one average density.
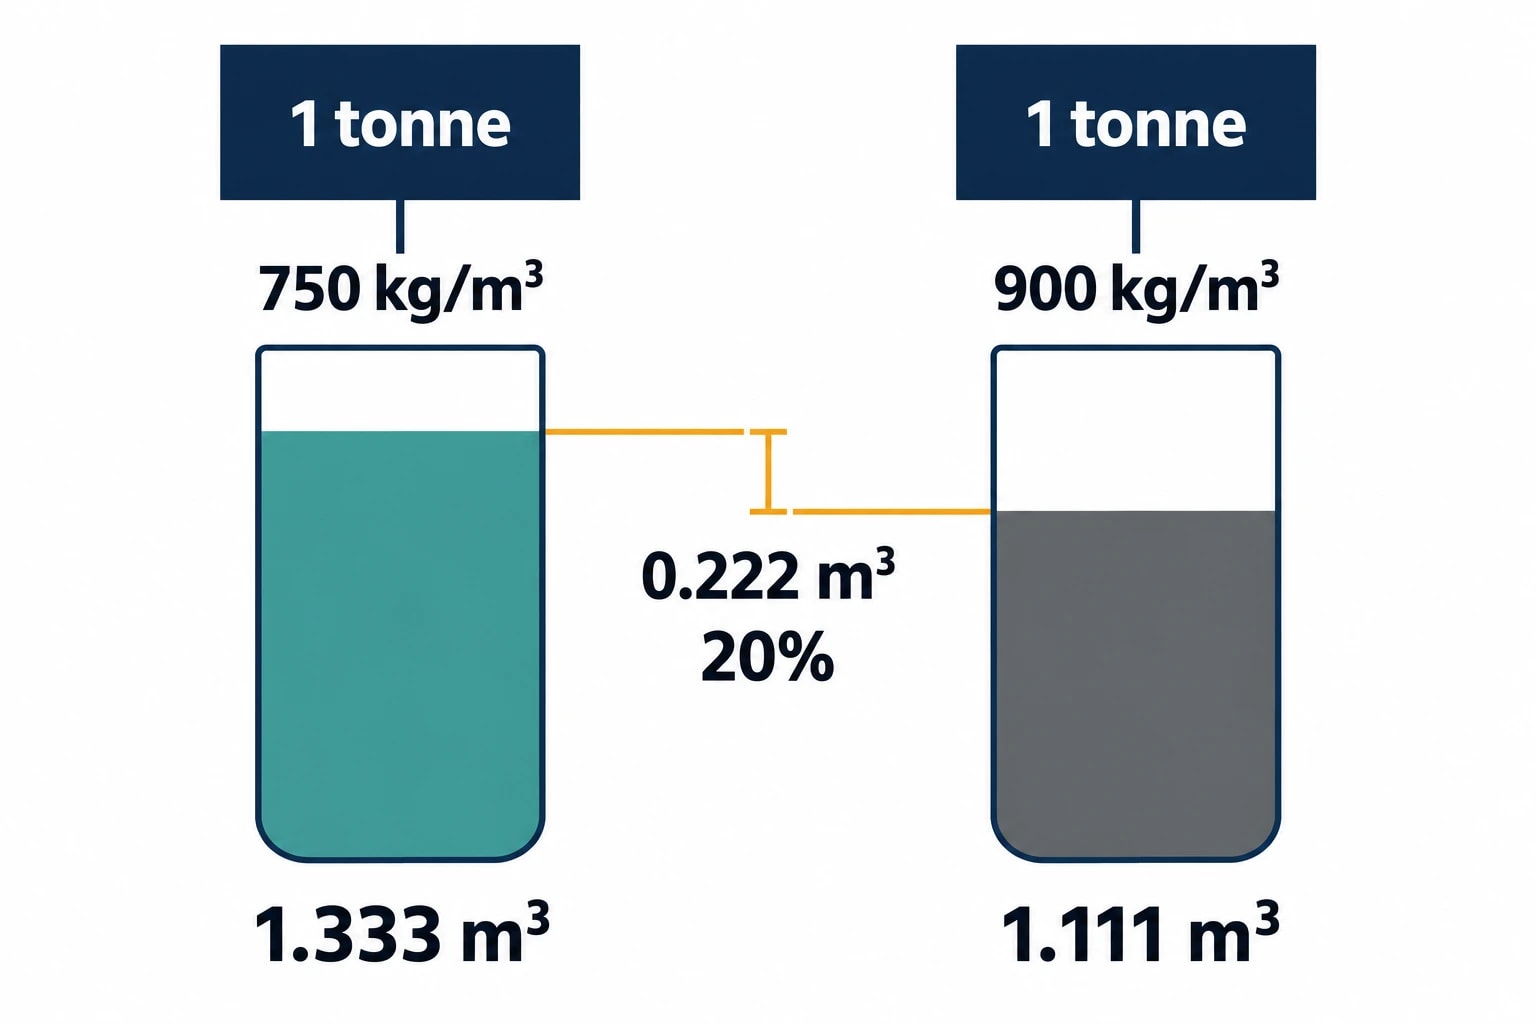
A simple density comparison shows why. One tonne of material at 750 kg/m³ occupies 1.333 m³. The same mass at 900 kg/m³ occupies 1.111 m³. The difference is 0.222 m³, or 20% relative to the denser fraction’s volume. Applying a single density to both fractions would distort volume yields and any reconstructed volume-basis distillation curve.
Use explicit acceptance checks
No universal percentage tolerance can substitute for the quality of the underlying laboratory data or the intended modelling decision. A credible assay fit should nevertheless meet predefined checks before engineers use it for CDU yield work.
| Acceptance check | Required comparison | Reason for the check |
|---|---|---|
| Mass closure | Original fraction mass yields, residue and declared losses against 100% of the stated assay basis | Confirms that the feed composition is complete |
| Volume closure | Reported and reconstructed volume yields using fraction density data | Tests conversion consistency |
| TBP point match | Fitted cumulative yield against each measured TBP point | Tests boiling-range allocation |
| Density match | Fitted pseudo-component or blend density against measured fraction density | Tests volume conversion and liquid property representation |
| Sulphur closure | Whole-crude sulphur against the mass-weighted pseudo-component slate | Tests contaminant allocation |
| Cutpoint sensitivity | CDU product yields across credible interpolations inside each wide assay interval | Shows the decision risk created by sparse data |
The project team should record the chosen tolerance beside each check, identify whether it reflects laboratory repeatability, a commercial planning limit or a model-validation target, and retain the original measurement alongside the fitted value.

Map every energy and material flow in your process with detailed heat and mass balance calculations — the foundation for any optimisation or design project.
Building pseudo-components for CDU decisions
Pseudo-component development should follow the decisions the CDU model must support. A compact planning slate may capture broad crude shifts. A detailed operating model needs greater resolution around actual draw boundaries and heat-recovery zones.
Place boiling intervals around separation boundaries
Uniform boiling intervals are convenient for data processing but can obscure a refinery’s important separations. More resolution is usually justified at the transitions between:
- Light ends and stabilised naphtha.
- Naphtha and kerosene.
- Kerosene and diesel.
- Diesel and atmospheric gasoil.
- Atmospheric gasoil and atmospheric residue.
These boundaries should align with the refinery’s draw locations, product specifications and planning cutpoints. A pseudo-component boundary placed far from an operational separation gives engineers little help when the model predicts the wrong draw yield.
Narrower intervals should only be added where assay data can support them. Creating many pseudo-components from sparse TBP points adds apparent detail without adding measurement information.
Fit connected properties, not isolated numbers
A pseudo-component needs a consistent set of properties. Its boiling behaviour, density, molecular weight, critical-property estimates and thermodynamic treatment must work together over the model’s temperature and pressure range.
Measured density provides an essential anchor. The fitted slate should reproduce both the cumulative TBP curve and fraction density data, rather than matching the curve while allowing unrealistic liquid properties. This discipline improves calculated volumetric yields, liquid traffic and enthalpy estimates.
The selected thermodynamic method must suit the crude system and study purpose. Engineers should document the method, property-estimation route and any adjusted inputs. Later users must be able to distinguish laboratory observations from fitted values and correlations.
Allocate sulphur by boiling range where possible
Whole-crude sulphur alone does not describe the quality of individual CDU products. Sulphur distribution by fraction provides a more useful constraint because it indicates where sulphur enters naphtha, middle distillates, gasoil and residue.
Fraction sulphur measurements should anchor the pseudo-component assignment. Where these data are unavailable, the model should label the allocation as estimated and assess the resulting uncertainty. Spreading sulphur evenly across the slate may close the whole-crude sulphur balance while misrepresenting individual side draws.
Handling light ends and the heavy tail
The ends of the assay often create the largest modelling difficulty. Light material affects feed preparation and overhead behaviour, while the heavy tail affects atmospheric-residue yield and CDU energy calculations.
Keep light-end assumptions visible
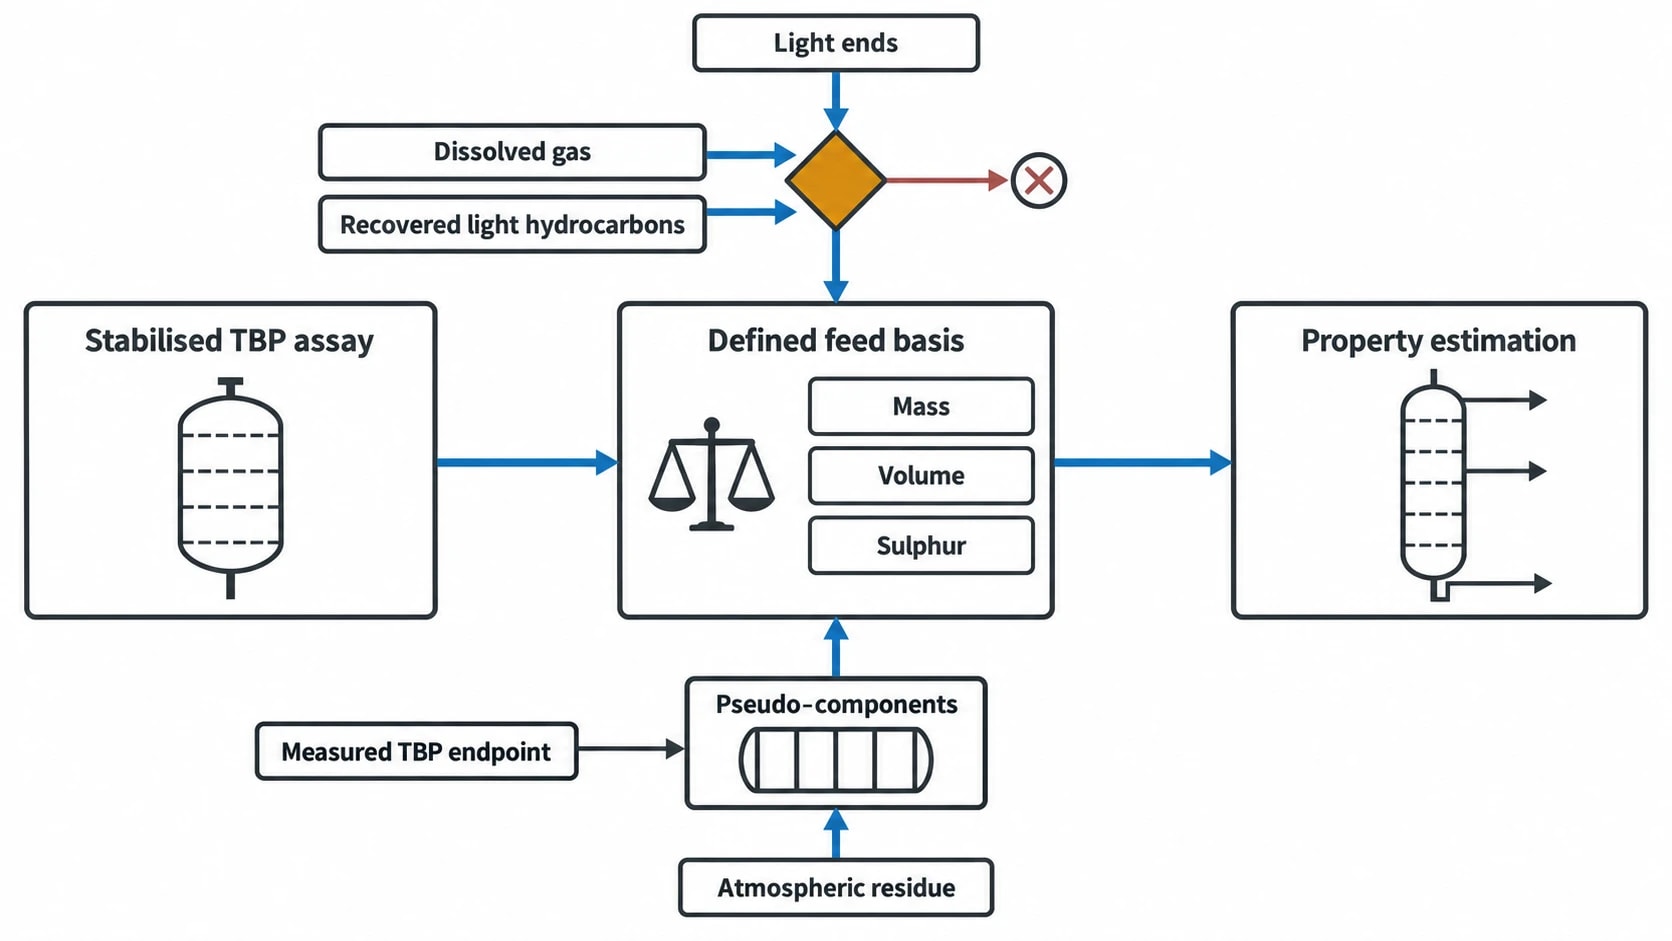
A stabilised crude assay may not describe all material that enters the CDU feed system under operating conditions. Engineers should identify whether the model feed includes dissolved gas, recovered light hydrocarbons, tank vapour losses or separately measured light-end composition.
The model must use one defined feed basis. Combining a stabilised TBP assay with an unverified light-end addition creates a feed that may no longer close on mass, volume or sulphur.
Characterise residue for the intended study
Atmospheric residue contains a broad range of high-boiling compounds. A pseudo-component treats this material as a calculation representative rather than a pure chemical species.
Documentation should state:
- The highest measured TBP point.
- The assumed atmospheric-residue endpoint.
- Any subdivisions used for residue or vacuum gasoil.
- The source of heavy-fraction density and sulphur values.
- The property-estimation method used beyond measured data.
A broad residue representation can be appropriate for an early CDU heat and mass balance. It becomes less defensible for vacuum-unit feed prediction, crude ranking by residue value or analysis of furnace and vacuum-column constraints.
Validating the CDU model against plant evidence
Assay fitting validates the feed representation. Plant comparison validates the CDU model as a whole. Both are necessary.
Select a coherent operating period
A useful validation period has stable crude composition and operating conditions. Feed rate, crude density, furnace outlet temperature, column pressure, product draw rates and laboratory results should represent the same operating window.
Process engineers should reconcile measured flows before tuning tower assumptions. Adjusting tray efficiency, stripping steam or pressure drop to conceal an unclosed feed balance produces a model that will fail when operating conditions change.
Compare independent model outputs
Validation should move from primary balance checks to performance and property checks:
- Confirm feed mass rate and density against the defined crude basis.
- Compare overall and product-level yields.
- Compare product densities and available distillation data.
- Compare furnace duty, flash-zone conditions and major pump-around heat loads.
- Compare draw temperatures and pressure profile.
- Compare sulphur distribution where product analyses are available.
- Document deviations, likely causes and the model’s approved application.
A yield mismatch may indicate a TBP-fit or cutpoint problem. A heat-duty mismatch may arise from property estimation, exchanger assumptions or unmeasured heat loss. A temperature-profile discrepancy can reflect pressure drop, stripping steam or column efficiency. Keeping those diagnoses separate preserves the integrity of crude assay data analysis.
This article reflects the independent analysis and editorial opinion of EnerTherm Engineering. Product names, trademarks, and brands mentioned belong to their respective owners. EnerTherm Engineering is not affiliated with, endorsed by, or a licensee of any third-party software or product mentioned unless explicitly stated.

Simulation Engineer — EnerTherm Engineering
Rajesh Sekar is a Simulation Engineer at EnerTherm Engineering, specialising in computational fluid dynamics (CFD), finite element analysis (FEA), and thermal process simulation. He holds a degree from Cranfield University and brings extensive experience in simulation-based product development from the automotive, aerospace, and energy sectors.
