Food Industry Carbon Reduction Targets: 50% by 2030
FDF targets Net Zero by 2040, while progress reports show a 36% gap to 2030 goals.
UK food-system emissions fell 14% between 2015 and 2023, leaving a 36% gap to the shared 2030 target. For food and beverage manufacturers, the objective demands auditable site-level action alongside supplier engagement.
The 50% food industry carbon reduction target explained
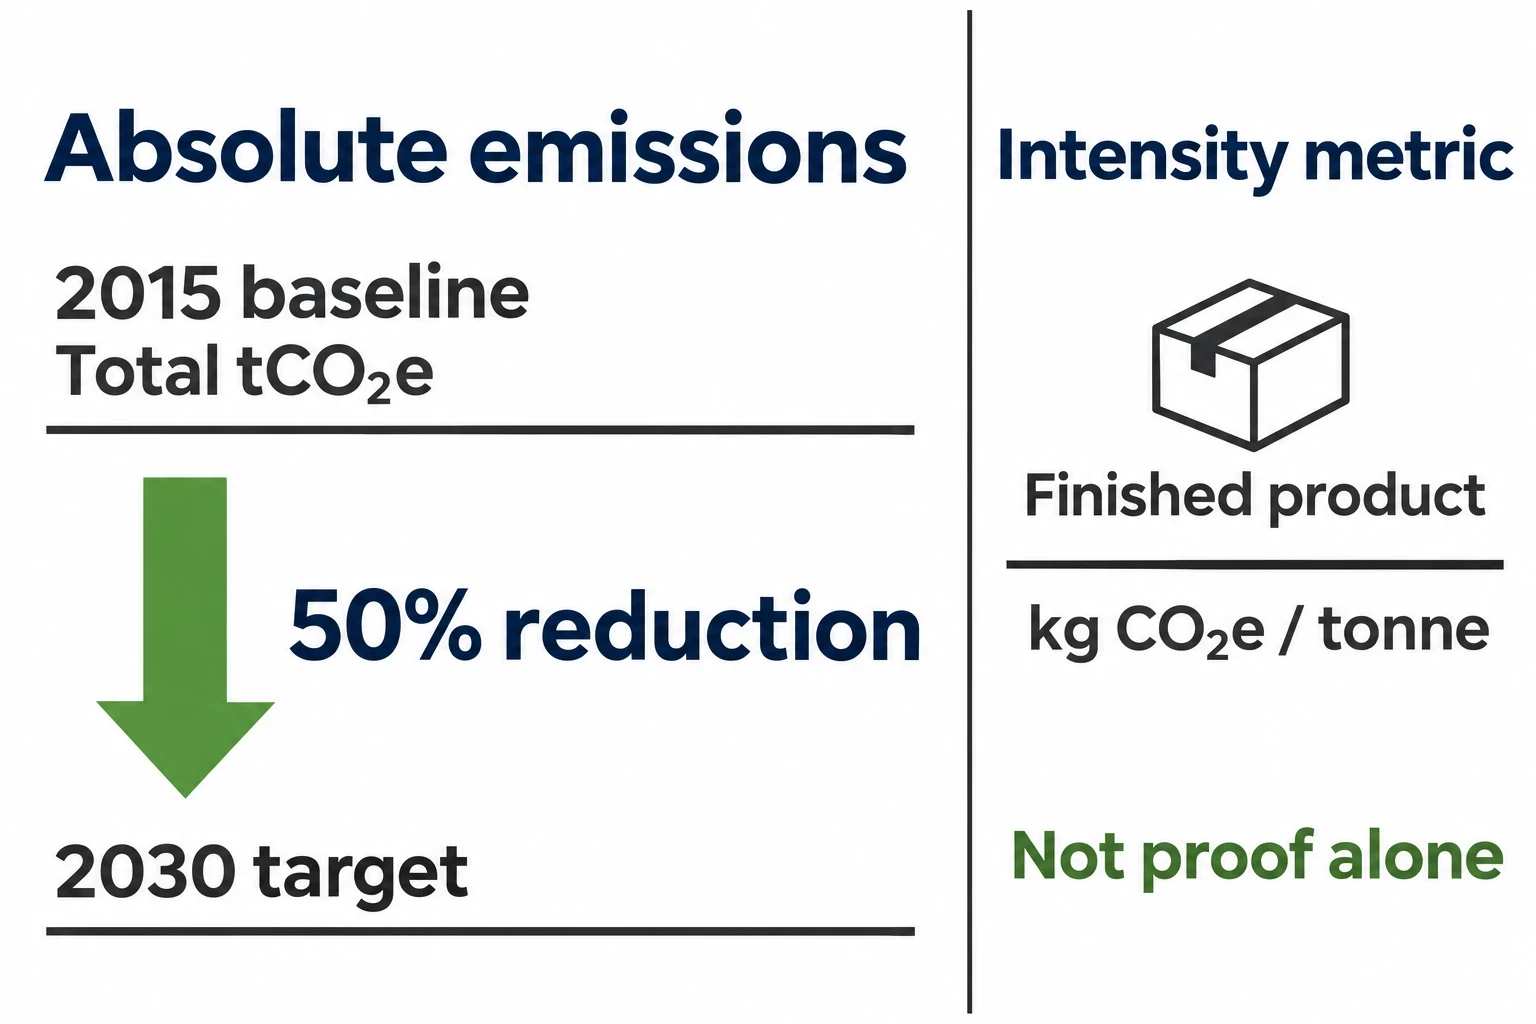
The Food and Drink Federation supports an agrifood supply-chain ambition to reduce absolute greenhouse gas emissions by 50% by 2030, using 2015 as the baseline, and to achieve net zero by 2040. It aligns with the UK Food and Drink Pact and wider food-system transition work led by WRAP, IGD and EY.
This is not a statutory rule requiring every UK site to halve its emissions. It is a shared sector objective. Manufacturers nevertheless face commercial pressure to demonstrate progress, as supermarkets, foodservice customers, lenders and brand owners use supplier carbon data in procurement and transition planning.
The target covers the full food system. A manufacturer may make major reductions in natural-gas use while still carrying a substantial product footprint from agricultural ingredients, imported commodities, packaging and distribution.
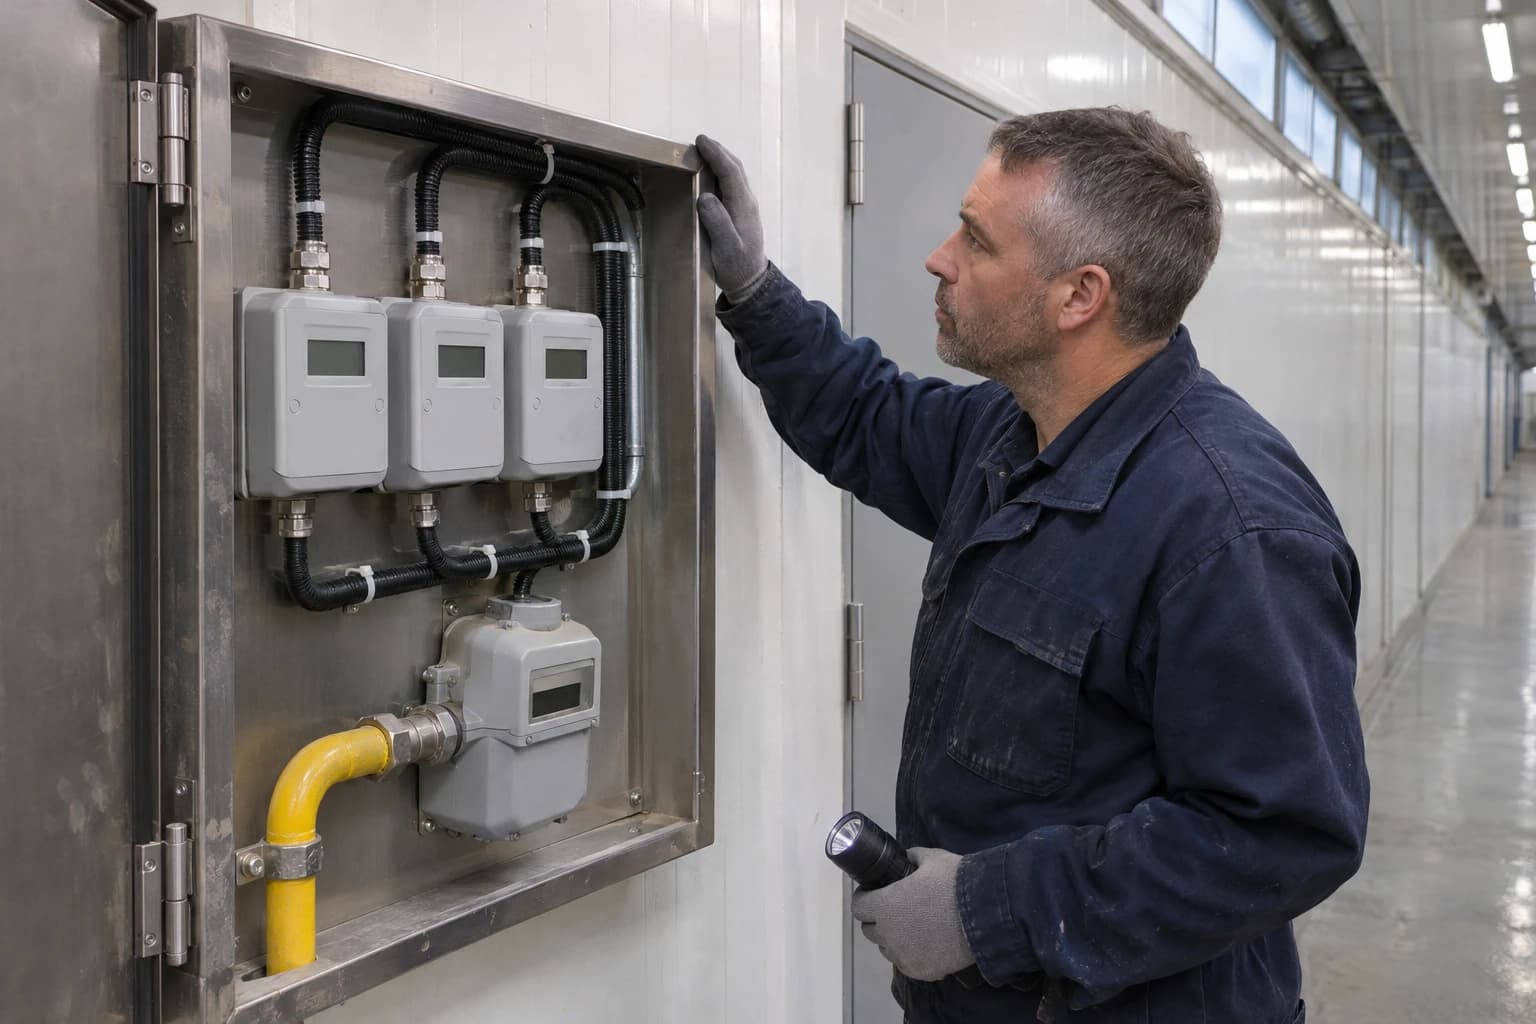
The Food and Drink Federation estimates that manufacturing represents around 6% of emissions associated with food consumed in the UK. Ingredients and imports account for much more. Yet site energy remains a direct operational responsibility, a material cost and a visible source of Scope 1 and Scope 2 emissions. It is also where a site can quickly produce reliable, meter-backed evidence.
Why a 2015 baseline needs careful handling
A 50% absolute reduction compares total tonnes of CO₂e with the selected baseline year. It does not mean reducing emissions per tonne of product while total production rises.
An intensity metric, such as kg CO₂e per tonne of finished product, can show improved operational efficiency. It cannot, by itself, prove that an absolute-emissions target has been met.
A credible baseline should document:
- Organisational boundaries, including acquired, sold, leased or outsourced operations.
- Operational boundaries for Scope 1, Scope 2 and relevant Scope 3 categories.
- Production volumes and product mix.
- Energy, refrigerant and fuel data sources.
- Emission factors and the year applied.
- Any historic recalculations after structural changes.
This evidence becomes essential when a retailer, investor or assurance provider asks how an apparent reduction was calculated.
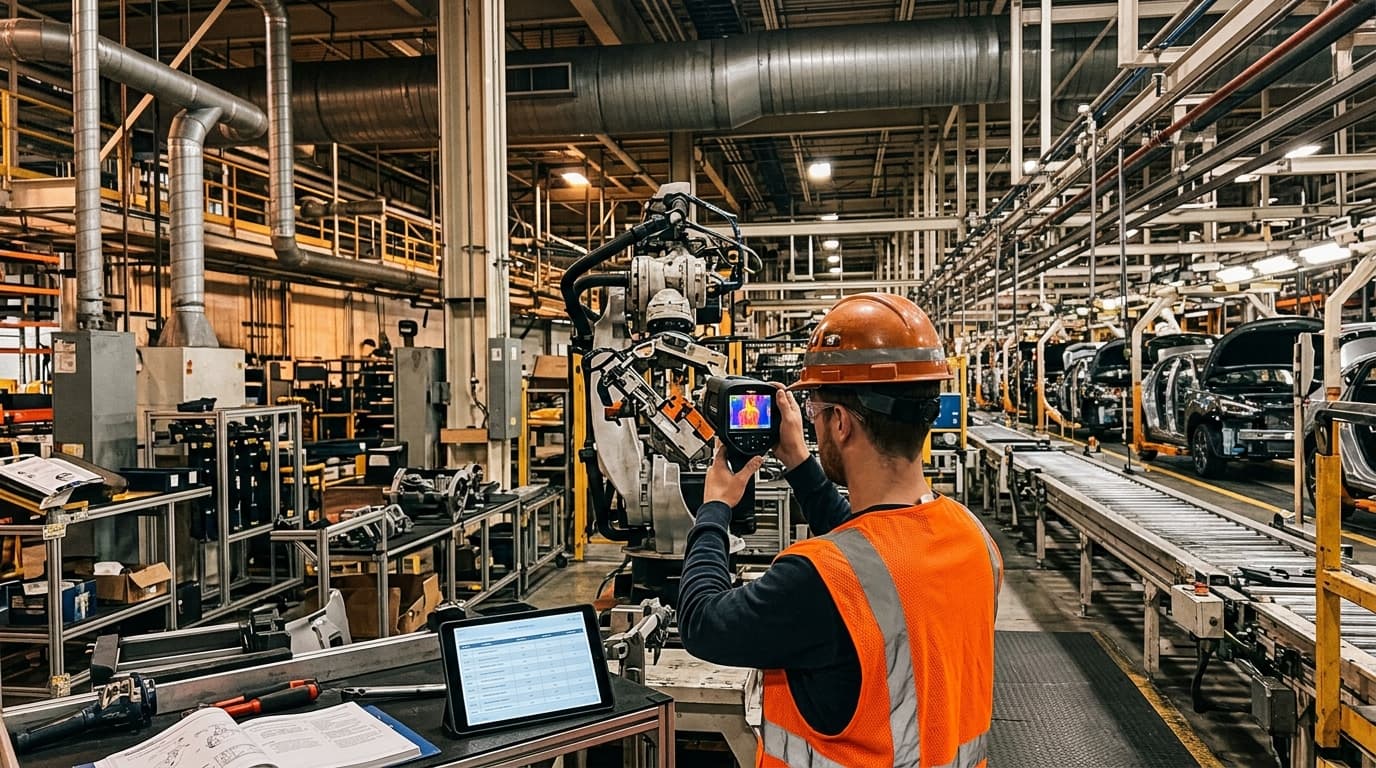
Identify where your plant is losing energy and quantify the savings potential — our audits map every heat source, sink, and waste stream in your facility.
Food industry carbon reduction targets sit within a wider compliance framework
The 2030 food-system target is voluntary, but UK manufacturers operate within binding reporting and energy-management requirements. Directors should separate legal requirements from customer conditions and voluntary commitments, then build one dataset capable of serving all three.
Streamlined Energy and Carbon Reporting
Streamlined Energy and Carbon Reporting, or SECR, applies to quoted UK companies and qualifying larger unquoted companies and LLPs. Qualifying unquoted companies and LLPs meet at least two of these thresholds:
| Threshold | Current qualifying level |
|---|---|
| Employees | 250 or more |
| Annual turnover | More than £36 million |
| Balance-sheet total | More than £18 million |
Quoted companies report global energy use and greenhouse gas emissions. In-scope unquoted companies and LLPs report UK energy use and associated emissions. The annual report must also describe energy-efficiency action taken during the reporting year and include at least one intensity ratio.
For a food site, an intensity ratio might use tonnes of CO₂e per tonne of product, per hectolitre packaged or per £ million revenue. Operational ratios are more useful for managing ovens, refrigeration, steam generation and compressed air. Revenue intensity can move with price inflation rather than physical performance, so it should not be the sole management measure.
ESOS Phase 4
The Energy Savings Opportunity Scheme, or ESOS, requires qualifying large undertakings to assess energy use and identify cost-effective savings opportunities. For Phase 4, a large undertaking has 250 or more employees, or turnover above £44 million and a balance-sheet total above £38 million.
ESOS is particularly relevant to heat-intensive food sites. Its assessment can identify energy-saving measures across buildings, industrial processes and transport. Phase 4 also requires progress reporting against action-plan commitments. A carbon roadmap should therefore record each measure from audit finding through approval, installation, metered performance and annual ESOS action-plan reporting.
Climate-related financial disclosures
Some large companies and LLPs also fall within mandatory climate-related financial disclosure rules. These apply to financial years beginning on or after 6 April 2022. A board-level transition plan needs more than a target statement. It should show climate-related risks, governance, strategy, metrics and targets in a form that can stand alongside statutory accounts.
The UK’s legal national target remains net zero by 2050 under the Climate Change Act 2008. Sector ambitions do not replace this framework. They bring the timetable forward for food and drink supply chains.
Build the carbon inventory before setting the factory roadmap
A carbon-reduction plan fails when the inventory cannot distinguish a genuine reduction from a change in output, supplier mix or accounting method. The GHG Protocol provides the standard scope structure.
Scope 1, Scope 2 and Scope 3 in food manufacturing
Scope 1 covers direct emissions from sources owned or controlled by the company. Typical site sources include gas-fired boilers, ovens, fryers, thermal-oil heaters, diesel vehicles and refrigerant leakage.
Scope 2 covers indirect emissions from purchased electricity, steam, heating and cooling. Refrigeration plants, compressed-air systems, pumping, ventilation and production-line motors often sit here through their electricity consumption.
Scope 3 covers other indirect value-chain emissions. In food and beverage manufacturing, purchased ingredients, agricultural production, packaging, inbound freight, contract processing, waste, distribution and product end-of-life can each be significant.
The inventory should provide two views:
- A corporate inventory for SECR, SBTi target setting and annual disclosure.
- A site and process inventory for engineering decisions.
The first establishes the target boundary. The second shows the engineering team where energy is lost and where investment will change measured emissions.
Move from bills to a usable factory baseline
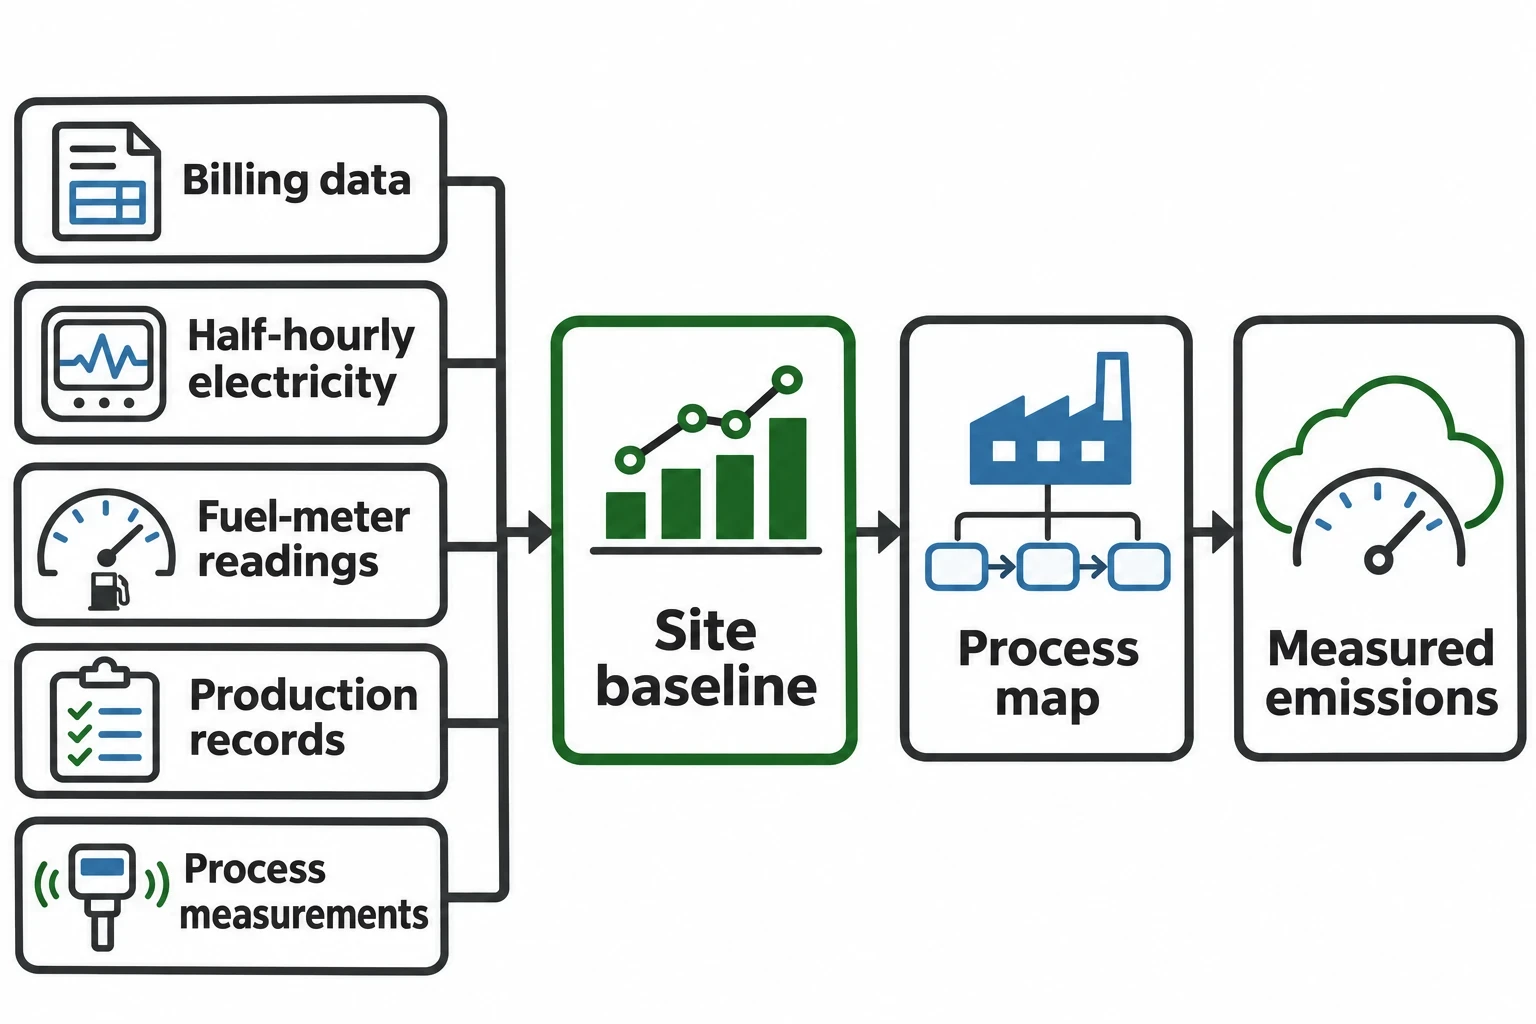
Utility invoices are a starting point, not an audit. They rarely explain why fuel use changed or identify a poorly controlled process.
A site baseline should combine billing data with half-hourly electricity data, fuel-meter readings, production records and process measurements. Portable power analysers can identify electrical load profiles. Thermal imaging can reveal insulation defects, hot pipework and oven leakage. Ultrasonic leak detection can locate compressed-air losses while production continues.
The audit team should map energy to the process:
- Steam generation, condensate return and blowdown.
- Pasteurisation, cooking and clean-in-place cycles.
- Baking, frying, drying and thermal treatment.
- Refrigeration compressors, condensers and defrost routines.
- Compressed air, process water and wastewater treatment.
- Idle, changeover and cleaning periods.
This work produces a baseline that accounts for production volume, product type, ambient conditions and operating hours. It also exposes discrepancies between a site’s carbon dashboard and its physical operation.

Identify where your plant is losing energy and quantify the savings potential — our audits map every heat source, sink, and waste stream in your facility.
Where food factories can secure credible carbon reductions
Energy efficiency and heat-loss reduction are not substitutes for longer-term heat decarbonisation. They reduce the demand that future low-carbon equipment must meet and generate the operational data needed to size it correctly.
Steam systems, ovens and process heat
Gas combustion for steam and direct process heat is often the principal Scope 1 source at a food site. The first action is to quantify heat demand, losses and operating controls.
Boiler opportunities include burner tuning, oxygen control where appropriate, condensate recovery, insulation repair, steam-trap maintenance and blowdown optimisation. A measured reduction in boiler fuel use directly reduces Scope 1 emissions.
Bakeries should assess oven exhaust temperature, excess air, door losses, loading patterns and warm-up periods. Frying operations should review exhaust, heat transfer, oil-temperature control and production timing. Tunnel dryers and thermal-treatment lines require particular attention to airflow, moisture removal and recirculation settings.
Waste-heat recovery can provide low-temperature heat for process-water preheat, cleaning applications or space heating where hygiene and separation requirements permit. Each proposal needs a food-safety review, maintenance plan and confirmation that temperature control remains within the process specification.
Electricity, refrigeration and compressed air
Electricity reductions are increasingly important as sites electrify heat and expand refrigeration capacity. Variable-speed drives can reduce unnecessary motor energy in pumps, fans and compressors where flow varies. Operators should validate any control changes against process requirements, particularly where pressure, airflow or cooling capacity protects product quality.
Refrigeration audits should examine suction pressure, condensing pressure, evaporator condition, defrost control, door management and heat-rejection opportunities. Refrigerant leakage needs separate attention because fugitive emissions can materially affect Scope 1 results.
Compressed air should be treated as a measured utility. Leak repairs, pressure reduction, compressor sequencing and removal of inappropriate air uses can reduce energy and maintenance demand. The system should be measured before savings are claimed.
Measurement and verification
Boards and retail customers need evidence after a project enters service. Measurement and verification should define the baseline period, boundary, data sources, production adjustment, expected savings and reporting interval before installation.
The International Performance Measurement and Verification Protocol provides a recognised framework for this work. For a boiler improvement, the boundary may be gas use at the boilerhouse. For a process-line project, it may include electricity, gas, throughput and product specification. The approach should match the scale and complexity of the measure.
EnerTherm Engineering’s seven-step audit methodology provides a practical route from initial consultation and on-site measurement through analysis, opportunity identification, reporting, implementation support and ongoing measurement and verification. This helps a site turn carbon targets into an investment register rather than a slide presentation.
SBTi and FLAG requirements for food manufacturers
The Science Based Targets initiative increasingly shapes retailer and supplier expectations. It requires companies to base climate targets on an emissions inventory, defined boundaries and recognised pathways.
At the date of publication, SBTi directs companies setting targets in 2026 to use the Corporate Net-Zero Standard Version 1.3.1. Corporate Net-Zero Standard Version 2.0 has been published, with target validation under that version due to begin in early 2027. Companies should confirm the applicable criteria at the point of submission because SBTi requirements and tools continue to develop.
Why FLAG matters
Food and Beverage Processing is an SBTi-designated FLAG sector. FLAG means Forest, Land and Agriculture. The guidance separates emissions associated with land and agriculture from energy and industry emissions.
SBTi requires a separate FLAG target alongside energy and industry targets where its criteria apply. Companies with limited FLAG emissions may not need a separate FLAG target, but those emissions still require inclusion within the overall target boundary.
For food manufacturers, this means Scope 3 work cannot rest on generic spend-based estimates indefinitely. Ingredient categories such as dairy, beef, pork, wheat, soy, maize, rice and palm oil may require more detailed supplier, commodity and land-use data.
Supplier engagement needs a data plan
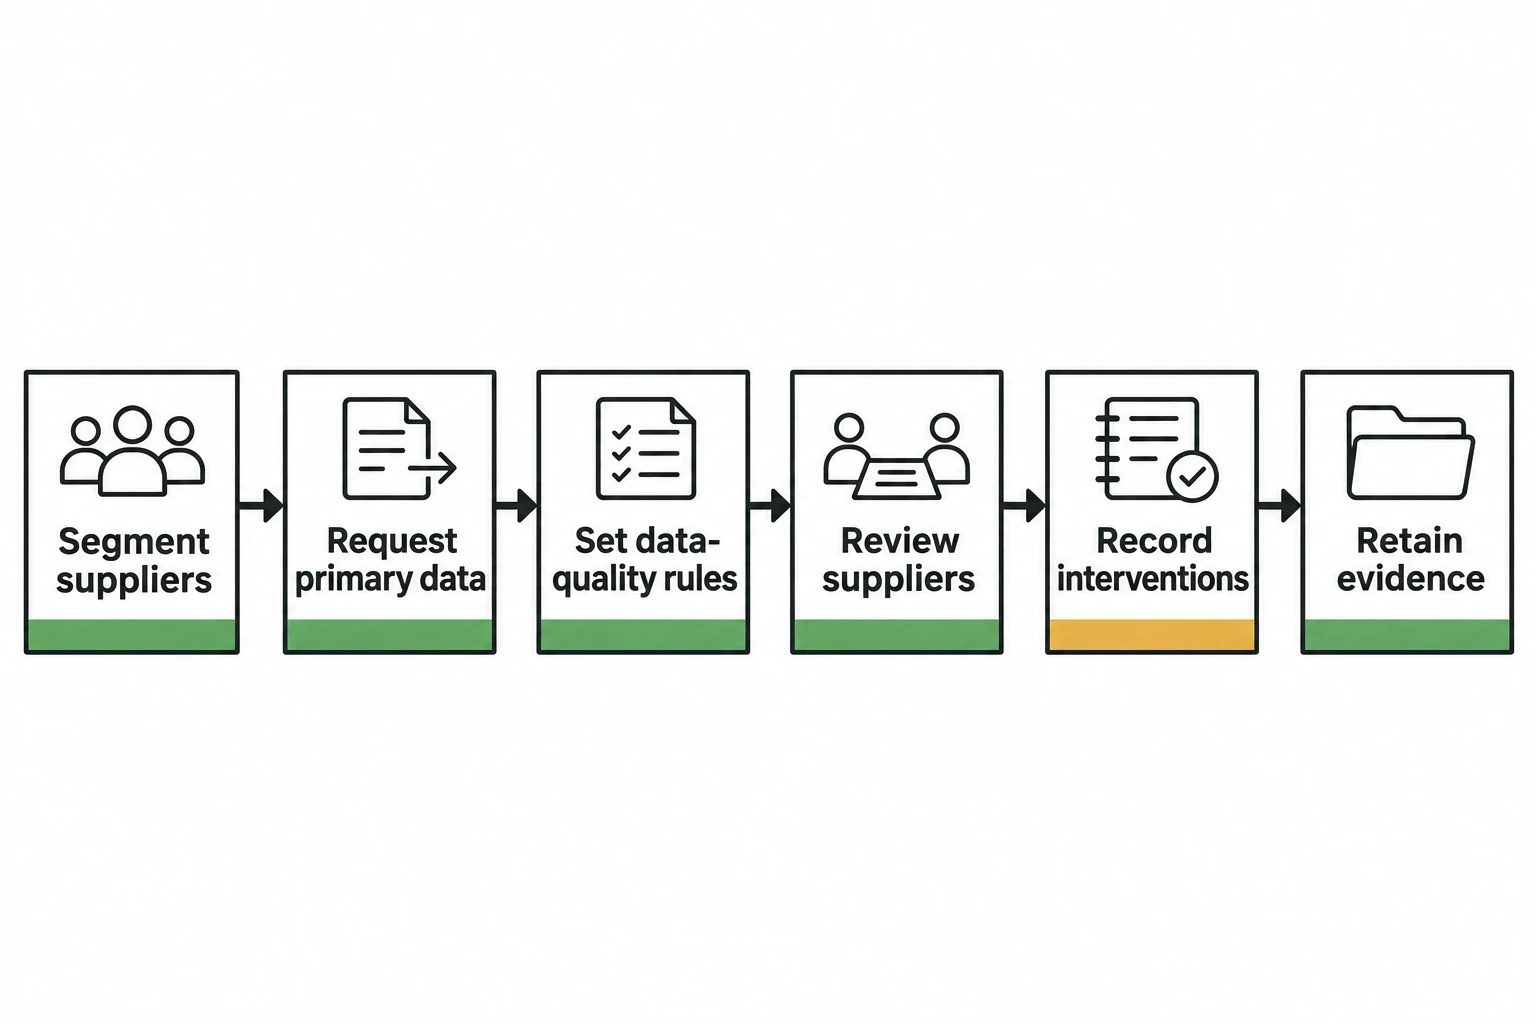
Procurement teams need a practical escalation route:
- Segment suppliers by emissions relevance, commodity and data quality.
- Request primary activity and emissions data from priority suppliers.
- Set data-quality rules and a deadline for replacing estimates.
- Embed emissions reporting and improvement plans in supplier reviews.
- Record interventions, such as feed changes, fertiliser management, renewable energy or food-waste prevention, without double counting reductions.
The manufacturer should retain evidence for emission factors, allocation choices and supplier claims. A retailer questionnaire often tests precisely these details.
Turn the 2030 target into a board-ready investment plan
A target gains operational value when the capital plan is tied to carbon, energy cost, production risk and compliance. A marginal-abatement-cost chart can help, but it should not override food safety, resilience or asset condition.
Prioritise measures by delivery confidence
A portfolio typically needs three groups of projects:
| Project group | Examples | Primary evidence |
|---|---|---|
| Operational control | Burner tuning, setpoint review, leak repair, shutdown discipline | Meter trends and operating records |
| Asset optimisation | Heat recovery, drives, insulation, condensate recovery | Engineering assessment and verification plan |
| Strategic replacement | Electrified heat, refrigeration replacement, major line redesign | Feasibility study, load profile and capital case |
Short-payback measures create early reductions and strengthen the data foundation for larger projects. Strategic heat projects require more time, electricity-capacity assessment, design work and planned downtime. The roadmap must show both.
A business case should state capital cost, energy-cost effect, annual tCO₂e reduction, maintenance implications, production constraints, project risk and expected payback. Net present value and internal rate of return can help directors compare projects with different lifetimes. Carbon should be reported as a physical outcome, not converted into a vague financial benefit.
Keep the carbon plan live
Annual emissions reporting is too slow for a 2030 target. Energy managers should review site data monthly, update the project register quarterly and recalculate the delivery forecast after major operational changes.
The forecast should identify whether the site is reducing absolute emissions, reducing intensity, or both. It should also list actions that depend on suppliers, grid capacity, landlord approval or major capital approval. That clarity prevents a site from presenting uncertain future reductions as delivered performance.
This article reflects the independent analysis and editorial opinion of EnerTherm Engineering. Product names, trademarks, and brands mentioned belong to their respective owners. EnerTherm Engineering is not affiliated with, endorsed by, or a licensee of any third-party software or product mentioned unless explicitly stated.

Managing Director — EnerTherm Engineering
Dr. François Pierrel is Managing Director of EnerTherm Engineering with over two decades of expertise in thermal design, heat transfer, and industrial energy optimisation. He holds a PhD in Heat Transfer from Cranfield University and a Post-Doctorate from Heriot-Watt University.
