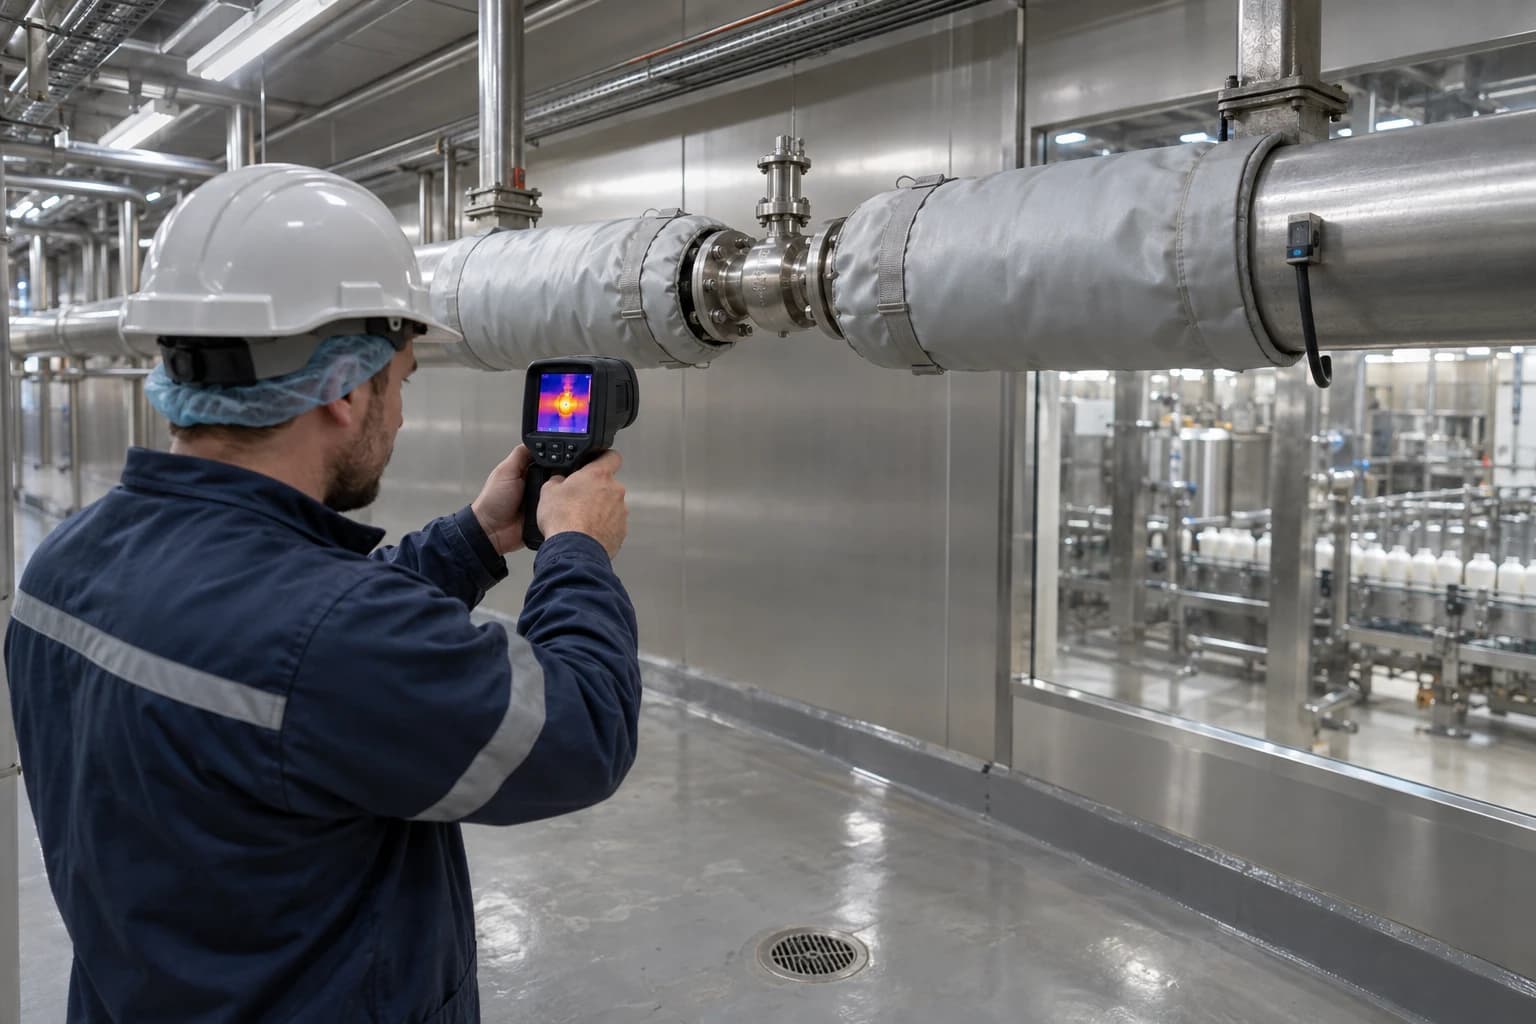
How Thermal Imaging Finds Heat Loss in Food Manufacturing
A low-disruption survey for steam leaks and insulation faults in food plants
Thermal imaging for food manufacturing is a non-contact inspection method that uses infrared cameras to identify abnormal surface-temperature patterns on process equipment, pipework and building fabric. It helps engineers locate heat loss without opening hygienic production systems.
A pasteuriser may run at its specified product temperature while a missing valve jacket leaks heat into the processing hall. A tunnel dryer may deliver throughput while damaged insulation makes part of its casing markedly hotter than adjacent panels. A steam main may look intact from the floor but reveal hot flanges, bare supports and wet insulation during a thermal survey.
These are common energy-audit findings in food and beverage plants. Heat is expensive to generate, difficult to contain around frequently cleaned equipment, and central to cooking, drying, sterilisation, cleaning in place and pasteurisation. Thermal imaging gives maintenance and utilities teams a fast way to identify priorities while production remains in operation.
How thermal imaging for food manufacturing works
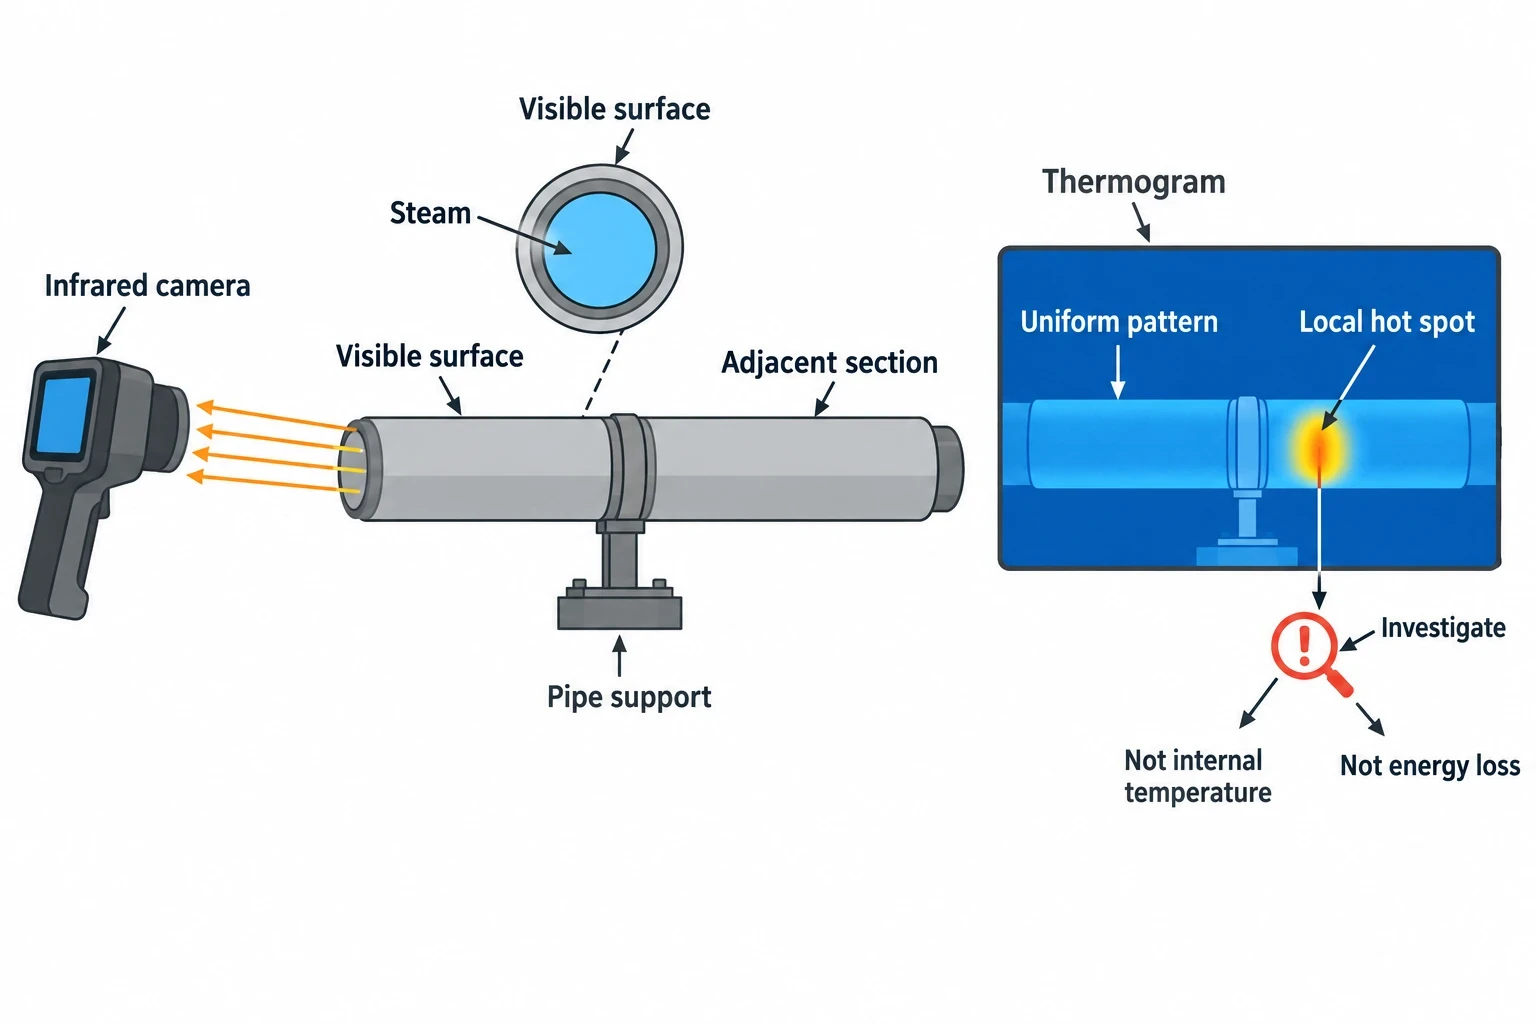
An infrared camera detects radiation emitted and reflected by a surface, then displays its temperature pattern as a thermogram. In an energy survey, the useful output is rarely a single temperature reading. Engineers look for variation.
A uniform, correctly insulated steam line should show a relatively even surface pattern. A local bright area on a thermogram may indicate exposed metal, compressed or damaged insulation, a failed removable cover, moisture under cladding, or a thermal bridge at a support. The finding becomes more meaningful when compared with adjacent components operating under the same process conditions.
Surface temperature is not process temperature
Thermal imaging measures the surface visible to the camera. It does not directly measure the temperature inside a pipe, vessel or oven. A high external temperature may indicate heat loss, but the scale of that loss depends on:
- Process-fluid temperature and pressure
- Pipe or vessel diameter
- Surface area
- Insulation type, thickness and condition
- Ambient air temperature and air movement
- Operating hours
- Fuel or electricity cost
- Surface emissivity used in the camera settings
A thermogram identifies where to investigate; it does not independently establish annual energy loss or the best insulation specification.
Why food plants suit non-contact surveys
Food sites contain many assets that are difficult to inspect during routine operation. Steam lines pass over production areas. Pipework enters insulated tanks. Oven casings sit behind guarding. Hot-water circuits serve cleaning in place systems during tightly planned sanitation windows.
A thermal camera allows a surveyor to inspect accessible surfaces at a distance, without contact with food-contact equipment or removing covers during the initial inspection. This suits a HACCP-controlled maintenance programme, provided the site’s hygiene, access and permit procedures govern the work.
Regulation (EC) No 852/2004, retained in UK food hygiene law, requires food premises and equipment to support maintenance, cleaning and disinfection. Annex II Chapters I, II and V address premises condition, hygienic processing areas and equipment requirements. Thermography supports those aims by locating condition issues without introducing probes, dismantling equipment or increasing exposure of product areas.
Identify where your plant is losing energy and quantify the savings potential — our audits map every heat source, sink, and waste stream in your facility.
Where heat loss appears in food and beverage factories
Thermal imaging for food manufacturing delivers the strongest results when the survey follows a process map: boiler house, distribution mains, point-of-use equipment, return systems and exhaust points.
Steam distribution and condensate systems
Steam remains a major thermal utility in dairies, breweries, bakeries, ready-meal plants and meat-processing facilities. Thermal surveys often find loss at components that insulation crews must leave accessible, including valves, flanges, strainers, steam separators and instrument connections.
Removable, reusable insulation covers can reduce this exposed area while preserving maintenance access. Their condition deserves the same attention as fixed pipe insulation. Open seams, damaged fasteners, missing sections and saturated insulation can create high surface temperatures and increase heat loss.
A thermal camera may reveal an unusually hot local area, disturbed insulation or a plume effect around a suspected steam leak, but it does not reliably prove a leak in isolation. An ultrasonic leak detector, visual inspection under an approved permit and examination of condensate behaviour provide stronger evidence. This reduces false maintenance call-outs.
Process vessels, heat exchangers and pasteurisers
Jacketed vessels, calorifiers, plate heat exchangers and pasteurisers can lose heat through uninsulated covers, access doors, manways and supports. Comparing similar assets under similar load often identifies the outlier quickly.
The hottest visible point is not necessarily the largest financial opportunity. A small hot valve can have a very high surface temperature but limited area. A large tank with a moderate surface temperature can lose more heat over a year because of its size and operating hours. Engineers need the thermogram and asset data to rank work properly.
Ovens, fryers and tunnel dryers
Bakery ovens, fryers and tunnel dryers are demanding thermal assets. Thermal imaging can identify damaged panels, degraded door seals, casing joints, missing lagging and hot spots around access openings. It can also show where changes in burner operation, product load or airflow have altered the external temperature pattern.
A thermogram does not replace combustion analysis, airflow measurement or product-quality monitoring. It directs attention to areas where those tests may be needed. If an oven casing runs hotter after a panel repair, the maintenance team can check insulation placement, panel alignment and sealing before the condition becomes a larger energy and workplace-comfort issue.
Refrigeration boundaries and chilled rooms
Thermal imaging also finds unwanted heat gain. Door seals, evaporator penetrations, poorly insulated pipework and gaps at building interfaces can appear as warm areas on the external side of a chilled enclosure.
Survey conditions matter. Condensation, wet surfaces and airflow can distort apparent temperature. Engineers should compare like-for-like areas and record whether defrost, washdown or door traffic affected the image.
What a thermogram can and cannot prove
A thermal image is strong evidence when interpreted with process knowledge. It is weak evidence when treated as a colour photograph.
Emissivity and reflected heat
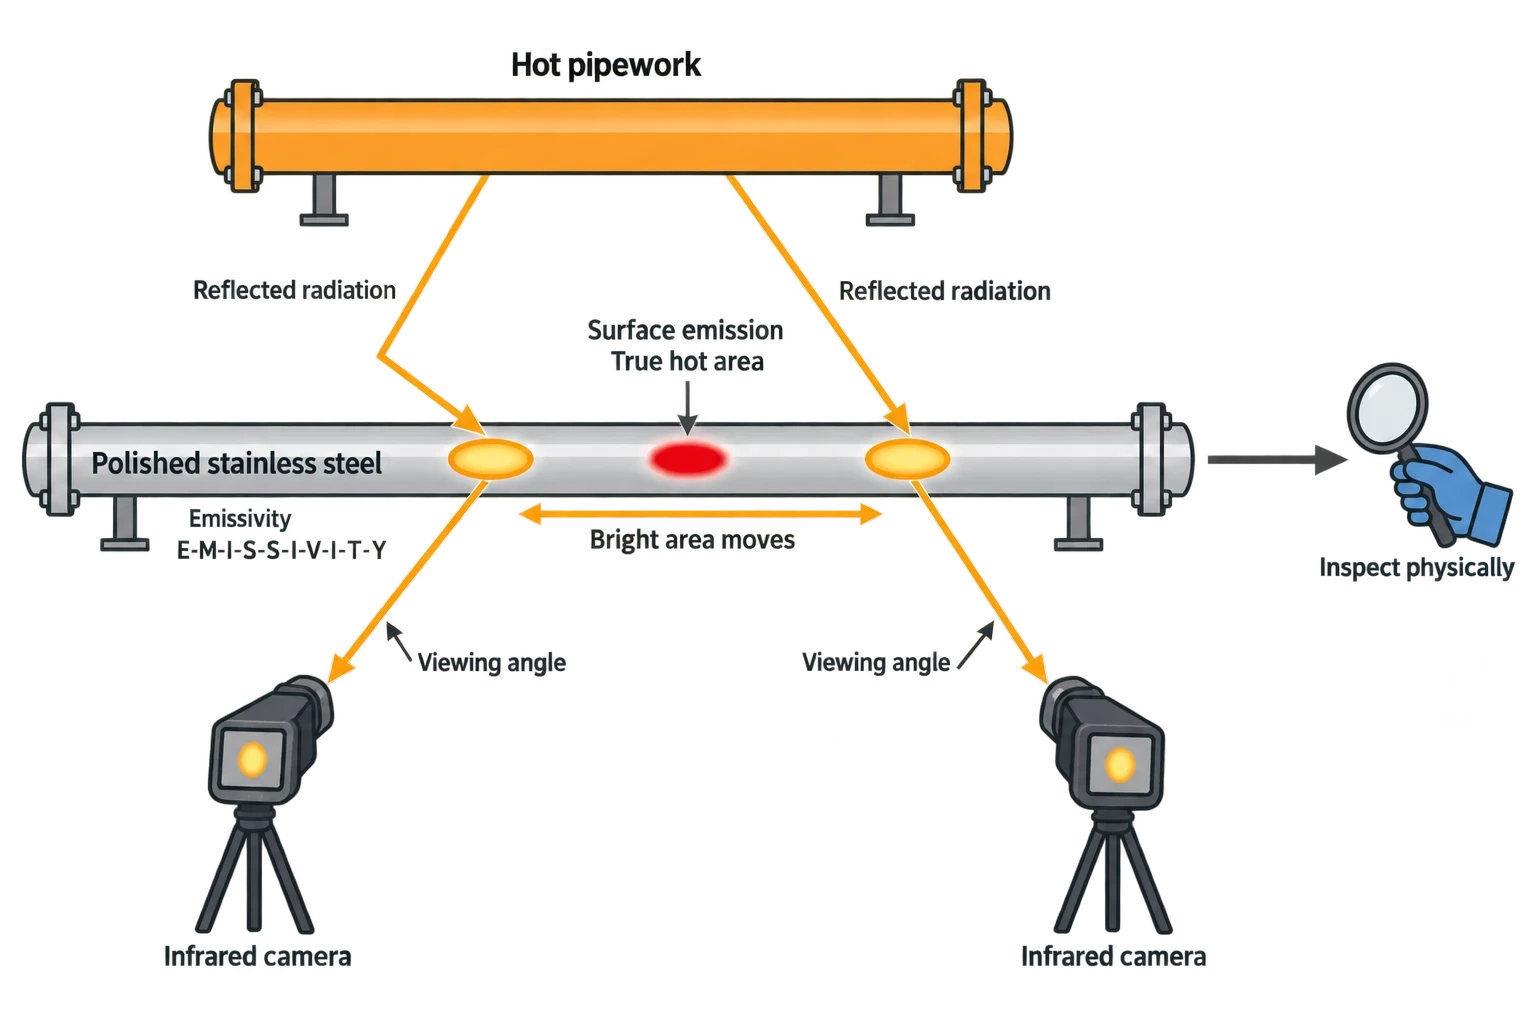
Emissivity describes how effectively a surface emits infrared radiation. Painted, oxidised and rough surfaces commonly behave differently from polished stainless steel, aluminium cladding and reflective valves. Food factories contain large amounts of stainless steel, which can reflect radiation from ovens, hot pipework, people and lighting.
A bright area on polished metal may be a reflection rather than a hot component. A competent surveyor confirms this by changing viewing position, comparing the reflected scene, inspecting the physical condition and using a suitable reference surface where site procedures allow.
SEMETS381, the UK National Occupational Standard for thermography testing, identifies emissivity, changes in emissivity with viewing angle, environmental conditions, camera sensitivity, external heat sources and material thermal properties as factors affecting inspection reliability. It also calls for checks of apparent reflected temperature, atmospheric conditions and surface emissivity where relevant.
Operating state changes the result
A survey needs a stable, representative operating condition. A steam pipe warming after shutdown, a vessel in a cleaning cycle, a fryer on standby and a tunnel dryer at full throughput will each produce different thermal patterns.
The survey record should state:
- Asset identification and location
- Date, time and shift
- Process state and approximate load
- Product or utility temperature where available
- Ambient conditions
- Camera position and viewing angle
- Insulation type and visible defects
- A matching conventional photograph
- Recommended verification action
This turns an image into a maintenance record that can be reviewed months later.
Moisture changes insulation performance
Wet insulation often changes surface-temperature patterns, but the direction and appearance depend on process and surrounding conditions. Corroded cladding, damaged joints and washdown exposure can allow water ingress. The resulting issue combines energy loss, corrosion risk and hygienic maintenance concerns.
Engineers should inspect suspicious areas physically during a planned maintenance window. Thermal imaging is a screening tool, not a substitute for checking cladding integrity, insulation condition and pipe-wall corrosion.

Identify where your plant is losing energy and quantify the savings potential — our audits map every heat source, sink, and waste stream in your facility.
Turning thermal images into quantified heat-loss opportunities
The energy case begins after the survey. For exposed steam lines, valves, flanges and tanks, engineers can use BS EN ISO 12241:2022 to calculate heat-transfer properties for industrial insulation applications, predominantly under steady-state conditions.
The calculation should use measured dimensions, process temperature, ambient conditions, insulation data and annual operating hours. It should distinguish between the existing condition and the proposed insulated condition. Applying a site-specific fuel price and boiler efficiency then converts reduced heat demand into cost and carbon estimates.
Prioritising insulation work
A practical ranking method combines technical, operational and financial considerations.
| Priority factor | What it means in practice |
|---|---|
| Surface area | Large vessels and long pipe runs can outweigh small, hotter defects |
| Surface temperature | Higher temperatures can indicate greater heat-transfer potential |
| Operating hours | Continuously operating assets accumulate losses rapidly |
| Process criticality | Repairs should align with shutdowns and food-safety controls |
| Access requirements | Removable insulation may suit valves, filters and instruments |
| Condition risk | Wet insulation and damaged cladding may require urgent examination |
| Cost and carbon | Site-specific energy prices and emission factors create a credible business case |
A recent UK beverage-facility TIPCHECK audit illustrates what a structured insulation assessment can reveal. The audit covered pasteurisers, heat exchangers, steam lines, syrup rooms and boiler rooms. It identified potential annual savings of 403,072 kWh and £96,738 from insulation upgrades, with more than 90% of savings associated with high-temperature systems. The case does not predict the same result for another factory, but shows why quantification matters after thermal anomalies have been found.
Pair thermography with an energy-audit standard
BS EN 16247 provides a framework for energy audits. Within that framework, thermal imaging contributes evidence during the site assessment, while calculation and opportunity ranking support the audit findings.
An insulation recommendation should state the component, present condition, proposed insulation arrangement, expected maintenance access, estimated energy saving, cost saving, carbon effect, installation constraints and assumptions. “Improve insulation” leaves too much work for the project team.
How to plan a hygienic, low-disruption thermal survey
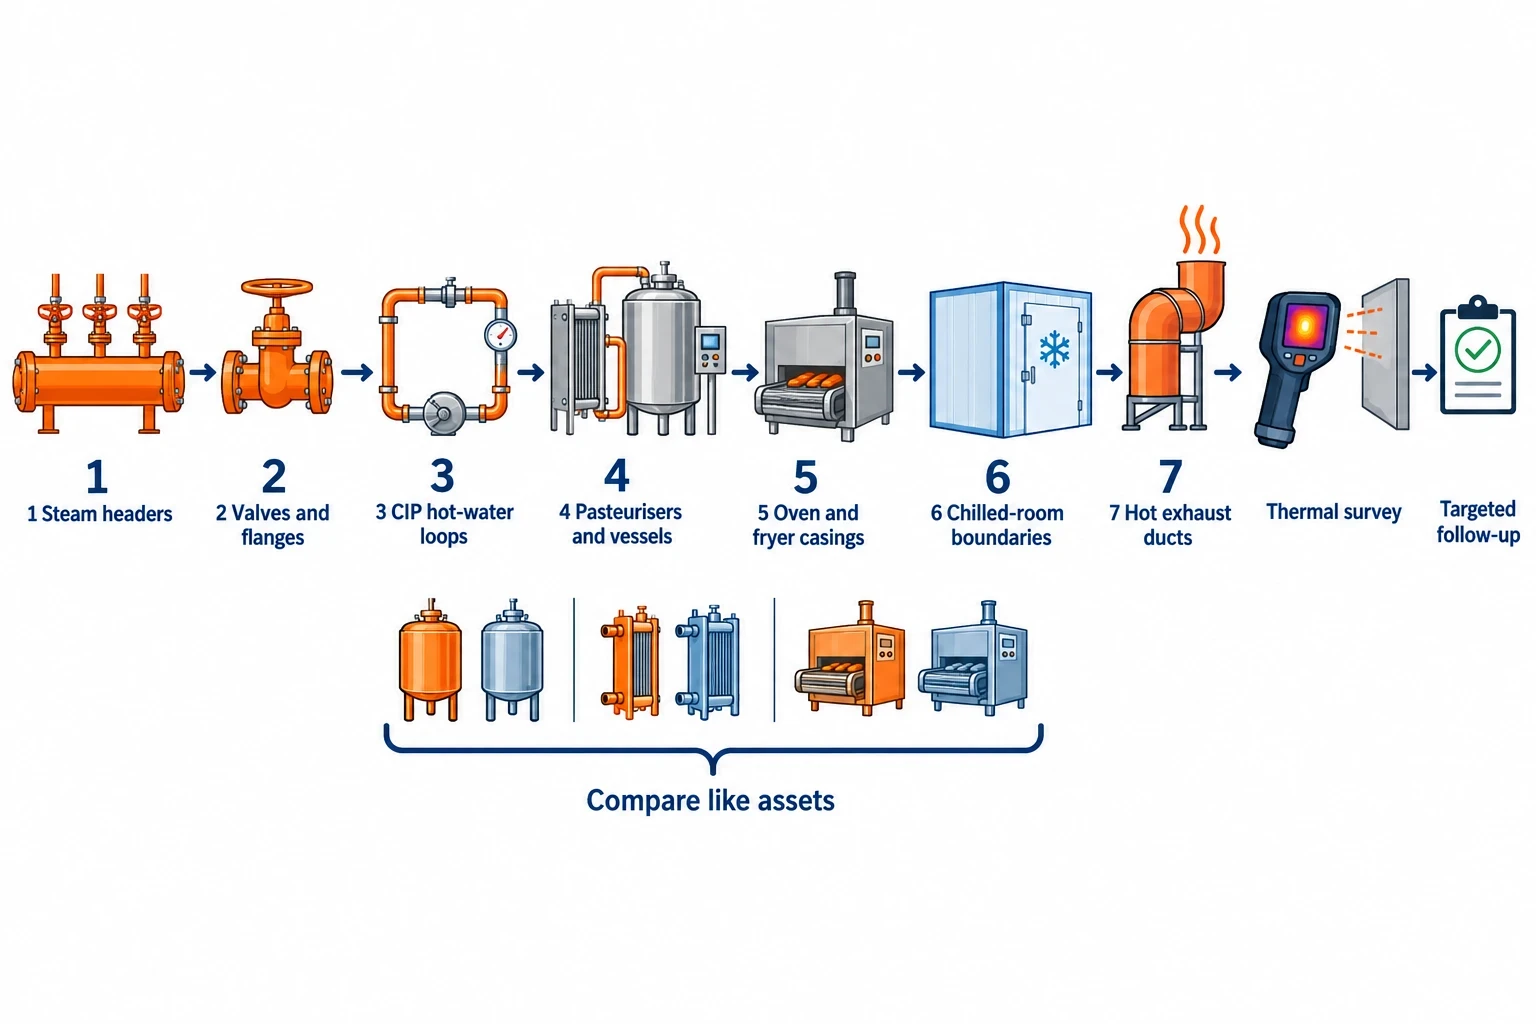
Food safety and production schedules determine the survey plan. The objective is to view equipment in a representative operating state while maintaining segregation, cleaning and access controls.
Agree the route with production and hygiene teams
Before the survey, the energy manager should agree the route with operations, engineering, hygiene and food-safety representatives. The route should identify high-care and low-care zones, PPE requirements, restrictions on cameras or electronic equipment, safe observation locations and times when doors, panels or plant guards can be viewed safely.
Thermographers should not enter restricted areas or cross hygiene boundaries without following site procedures. Non-contact inspection reduces interaction with equipment, but does not remove the requirement for hygiene discipline.
Focus on accessible, high-value assets first
A short survey can produce useful results when it starts with the equipment most likely to generate recoverable losses:
- Boiler outlets, steam headers and distribution mains.
- Bare valves, flanges, strainers and condensate components.
- Hot-water loops serving cleaning in place, cooking and pasteurisation.
- Pasteuriser housings, heat exchangers and process vessels.
- Oven, fryer and dryer casings, doors and joints.
- Refrigerated-room boundaries, doors and penetrations.
- Hot exhaust ducts where safe access allows inspection.
The route should include comparable assets. Two similar hot-water vessels, two oven doors or two branches of a steam main offer an internal benchmark that helps distinguish a genuine anomaly from normal operation.
Use the right follow-up test
Thermal imaging should trigger the appropriate test rather than force one technology to answer every question.
| Thermal finding | Suitable follow-up |
|---|---|
| Bare or damaged insulation | Measure dimensions, confirm operating conditions and calculate loss |
| Local hot spot on stainless steel | Change viewing angle, check for reflections and inspect condition |
| Suspected steam leak | Use ultrasonic detection and follow site permit procedures |
| Hot oven casing section | Inspect panel, seal and insulation condition, then check burner and airflow performance if required |
| Warm spot at chilled-room boundary | Check seal, vapour barrier, penetration detail and door operation |
| Repeating hot electrical connection | Escalate to a competent electrical inspection process |
This gives maintenance teams evidence specific enough to plan corrective work.
Building thermal imaging into food manufacturing energy management
A single survey finds defects. A repeatable programme finds deterioration and confirms whether repairs have delivered the expected result.
Establish a baseline and repeat it under similar conditions
The first survey should create an asset register with thermal and visual images, inspection conditions and observed defects. Repeat surveys should occur at similar process loads where possible. A bakery oven at normal production rate should be compared with its own normal-production baseline rather than an image taken during warm-up.
Trend records can identify recurring insulation damage in washdown zones, removable-cover failures around frequently serviced valves and heat loss that reappears after mechanical maintenance.
Verify the implemented savings
After insulation repairs, the site should inspect the work for coverage, cladding condition, clearances and maintenance accessibility. A follow-up thermogram can confirm reduced external surface temperature, but energy savings require a broader check.
EnerTherm Engineering’s seven-step audit approach places thermal imaging within a wider sequence: consultation, on-site assessment, data analysis, opportunity identification, reporting, implementation support and measurement and verification. For substantial projects, the measurement and verification plan should define the relevant energy meter, baseline period, operating variables and exclusions before work starts. IPMVP methods can then support a transparent assessment of realised savings.
Treat findings as maintenance and energy data
The most useful thermal-image report links each finding to an asset, work order and energy opportunity. This allows the utilities manager to distinguish urgent safety or condition work from planned energy improvements, and gives finance teams a basis for assessing payback against site energy costs.
This article reflects the independent analysis and editorial opinion of EnerTherm Engineering. Product names, trademarks, and brands mentioned belong to their respective owners. EnerTherm Engineering is not affiliated with, endorsed by, or a licensee of any third-party software or product mentioned unless explicitly stated.

Managing Director — EnerTherm Engineering
Dr. François Pierrel is Managing Director of EnerTherm Engineering with over two decades of expertise in thermal design, heat transfer, and industrial energy optimisation. He holds a PhD in Heat Transfer from Cranfield University and a Post-Doctorate from Heriot-Watt University.
