
Why Food and Beverage Energy Benchmarking Matters for ESOS
DESNZ data records 1,530.58 ktoe of gas and 938.28 ktoe of electricity demand.
In 2023, UK food and drink manufacturing consumed 1,530.58 ktoe of natural gas and 938.28 ktoe of electricity. That split matters for energy managers. A site can improve total energy per tonne while gas performance worsens in steam generation, ovens or thermal processing, or electricity use rises in refrigeration, compressed air and pumping.
Food and beverage energy benchmarking separates those effects for ESOS participants. It links utility consumption with production output, operating conditions and defined process boundaries. The resulting evidence can identify underperforming plant, prioritise audits and support investment decisions.
For dairy plants, meat processors, bakeries and beverage facilities, the need is immediate. ESOS Phase 4 qualification is assessed on 31 December 2026, and compliance notifications are due by 5 December 2027.
Food and beverage energy benchmarking removes production noise
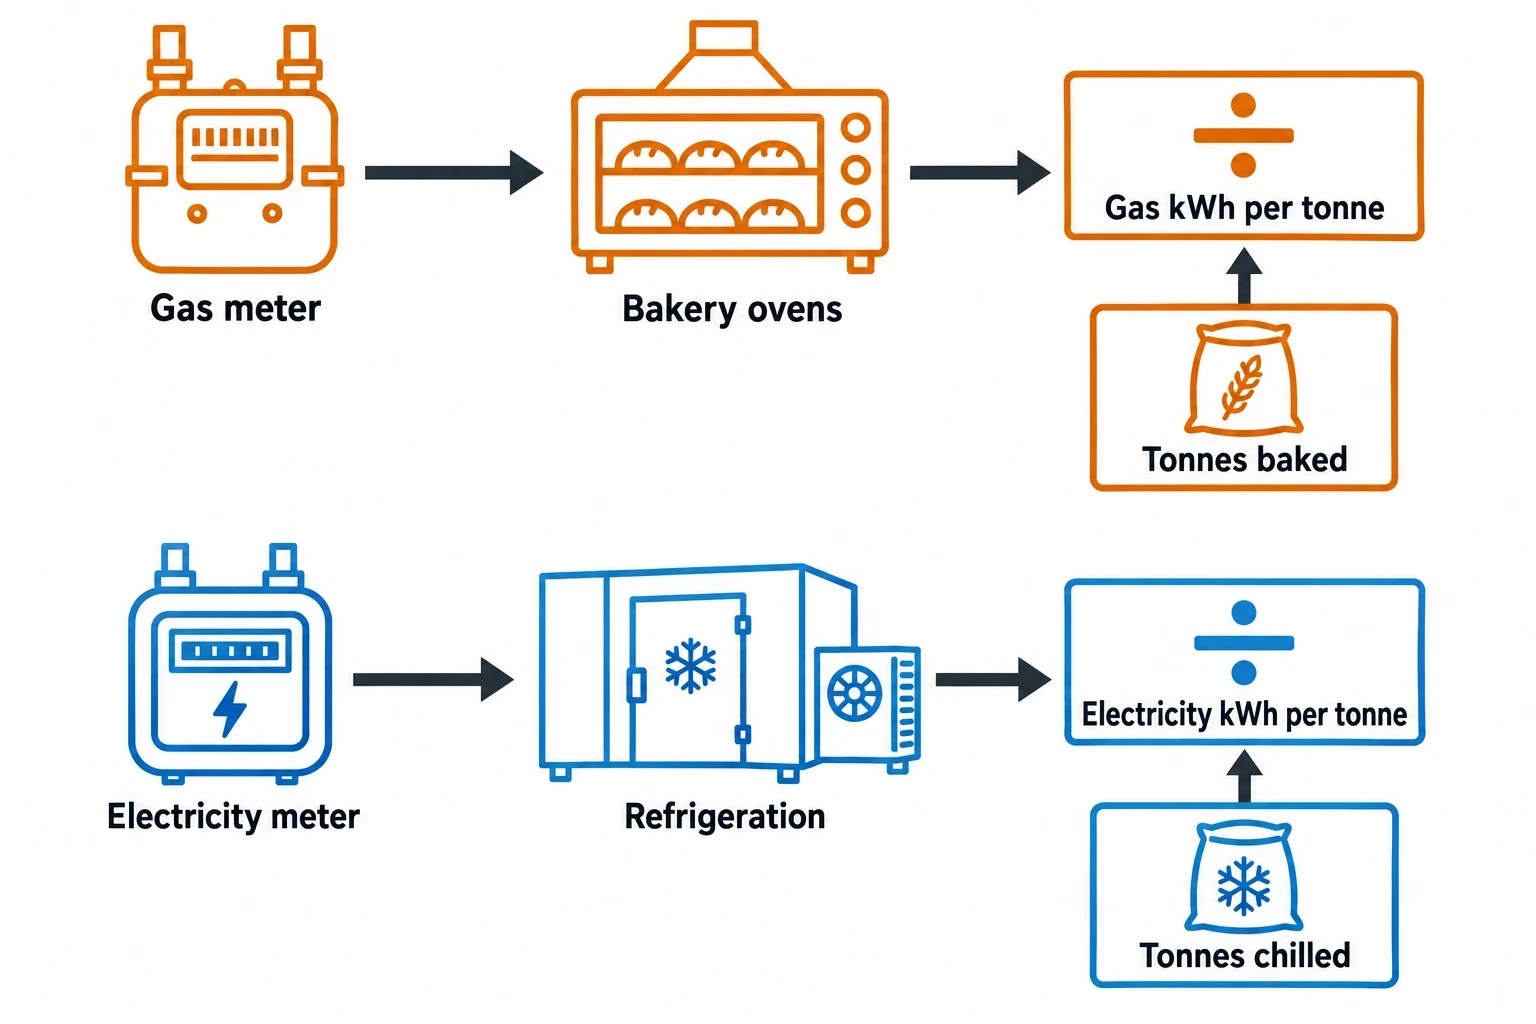
An energy bill records consumption and cost. It does not show whether a factory operated efficiently.
Output changes with seasonal demand, product mix, line availability, cleaning schedules, rejects and production hours. A bakery producing several small batches can use more oven gas per tonne than during a long, stable campaign. A dairy handling a different product mix may alter pasteurisation, refrigeration and cleaning demand without a fault in its utility plant.
Food and beverage energy benchmarking turns raw consumption into ratios related to physical activity. Those ratios give engineers a repeatable basis for comparison over time.
Match the energy metric to the process
The denominator must reflect the activity that drives energy use. Total site kWh per tonne of saleable output is useful for senior reporting, but too broad to diagnose poor performance.
A bakery may track oven gas use per tonne baked by product family. A dairy may measure refrigeration electricity per tonne chilled and steam per litre processed. A beverage plant may monitor compressed-air electricity per thousand filled units.
| Manufacturing area | Energy metric | Suitable activity denominator | A worsening result can indicate |
|---|---|---|---|
| Steam and hot water | Gas kWh per tonne of steam | Tonnes of steam generated | Boiler losses, excess pressure, poor condensate return |
| Bakery ovens | Gas kWh per tonne baked | Tonnes baked by product family | Excess exhaust, burner set-up issues, idle running |
| Refrigeration | Electricity kWh per tonne chilled or frozen | Tonnes chilled or frozen | Condenser fouling, poor suction control, door losses |
| Compressed air | Electricity kWh per 1,000 packed units | Filled or packed units | Leaks, excessive pressure, unloaded compressor running |
| CIP | Thermal energy per verified cycle | Cleaning cycles, with circuit and volume recorded | Extended cycle time, poor return temperature, excess make-up water |
| Pasteurisation or cooking | Thermal energy per tonne processed | Tonnes through the line | Heat-recovery losses, start-up losses, set-point drift |
A metric also needs a stated boundary. Refrigeration electricity, for example, should specify whether it includes blast freezers, cold stores, glycol pumps, condenser fans and associated lighting. Without a common boundary, sites can appear comparable while measuring different loads.
Why a single total-energy KPI can conceal waste
Heat and power have different cost structures, carbon factors, equipment types and failure modes. Combining them too early can hide an actionable problem.
A refrigeration-controls project may reduce electricity intensity while slightly increasing pump load. A heat-recovery project can reduce gas demand while requiring additional electrical pumping. Both may still reduce operating cost and emissions.
DESNZ’s 2023 sector dataset supports separate gas and electricity benchmarks. Natural gas remained the larger energy demand in food and drink manufacturing, while electricity was a substantial, distinct load. A credible programme should retain separate indicators before producing a site-wide measure.
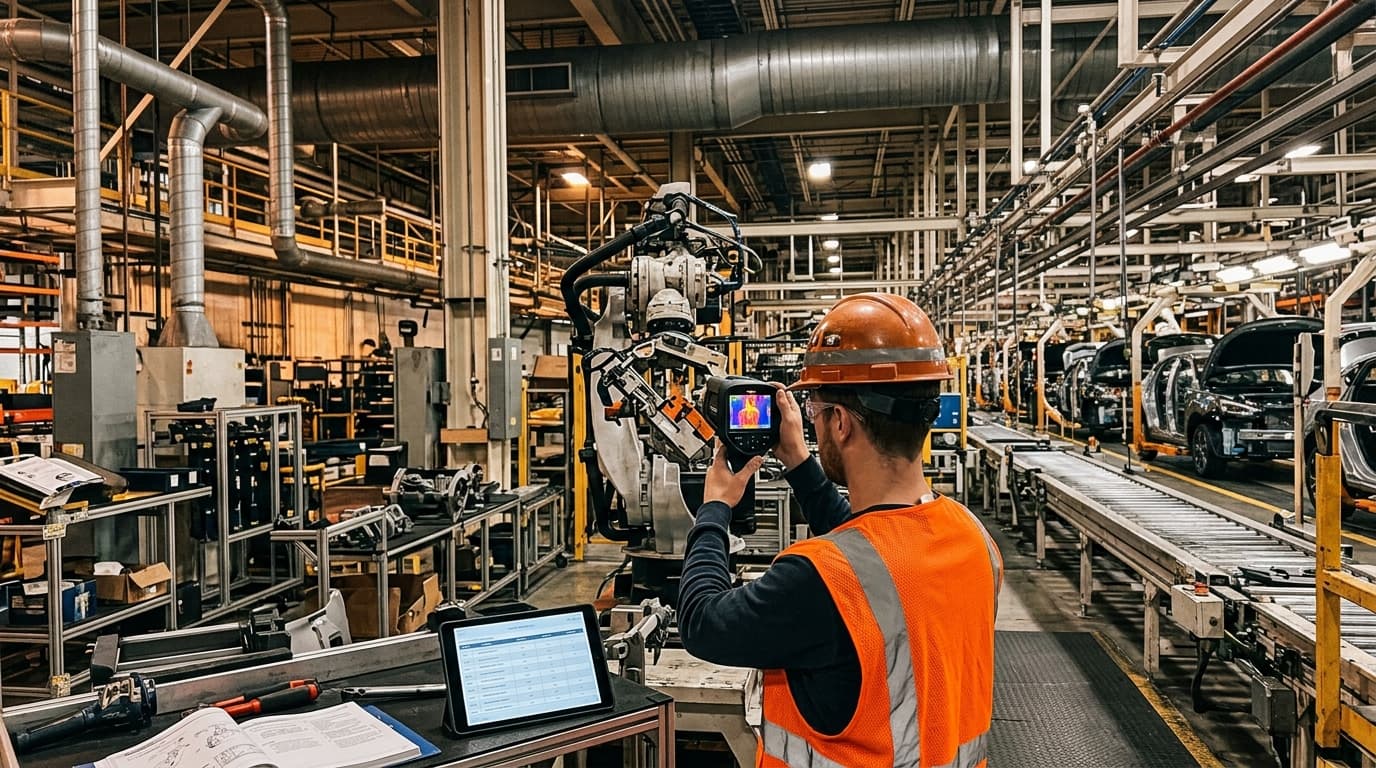
Identify where your plant is losing energy and quantify the savings potential — our audits map every heat source, sink, and waste stream in your facility.
ESOS Phase 4 makes energy intensity ratios more important
The Energy Savings Opportunity Scheme Regulations 2014, as amended, require organisations to calculate energy intensity ratios for buildings, transport, industrial processes and other energy uses where applicable.
For industrial food and beverage sites, the industrial-process ratio is often the most useful indicator. It connects energy with output rather than treating production consumption as an unexplained total.
What ESOS requires from an energy intensity ratio
An ESOS energy intensity ratio relates energy consumption in kWh to a relevant activity indicator. For industrial processes, that indicator can be tonnes, litres, units packed or another measure representing actual output.
The indicator must be:
- Quantifiable.
- Associated with the assets or activities being assessed.
- Calculated from verifiable data where reasonably practicable, or from a reasonable estimate.
Turnover is a weak choice for a food factory because price movements, customer contracts and product mix can change revenue without corresponding changes in energy use. Production output provides a more stable engineering reference.
For a multi-site group, the ratio must avoid double counting. If one factory produces a food product and another packs it, the group should use final output from that chain when reporting a consolidated process ratio.
The 95% significant-energy-consumption rule affects audit scope
Areas of significant energy consumption must account for at least 95% of total energy consumption where the energy-audit route is used. The remaining maximum 5% is de minimis consumption.
This prevents an assessment from concentrating on the boiler house or a prominent refrigeration plant while omitting other material loads. A food manufacturer should establish a register covering:
- Imported electricity, gas, other fuels and on-site generation.
- Boilers, ovens, fryers, dryers, pasteurisers and cooking systems.
- Refrigeration plant, cold stores and process cooling.
- Compressed-air systems, vacuum equipment and major pumping loads.
- CIP, hot-water generation and cleaning-related thermal demand.
- Buildings and transport where they fall within the organisation’s energy use.
- Output, operating hours, product mix, rejects and rework.
- Meter locations, data gaps and estimates.
This creates an evidence base for ESOS compliance and plant management, while exposing incomplete energy data before an audit team quantifies savings.
Phase 4 timing creates a practical investment window
A UK undertaking qualifies for ESOS Phase 4 if, on 31 December 2026, it has 250 or more employees, or turnover above £44 million and a balance-sheet total above £38 million. Corporate groups qualify where at least one UK group member meets the definition.
The compliance notification deadline is 5 December 2027. Sites that begin benchmarking before qualification can assemble a full production cycle of data, establish stable baselines and resolve metering gaps. This produces stronger project appraisals than a late assessment based on estimated output or incomplete interval data.
Phase 4 also requires participants to report progress against action-plan commitments, including explanations for proposed measures that were not implemented. Production changes, hygiene constraints, altered shutdown opportunities and revised engineering estimates can affect delivery. A documented benchmark provides a factual basis for those explanations.
Benchmarking identifies the source of poor utility performance
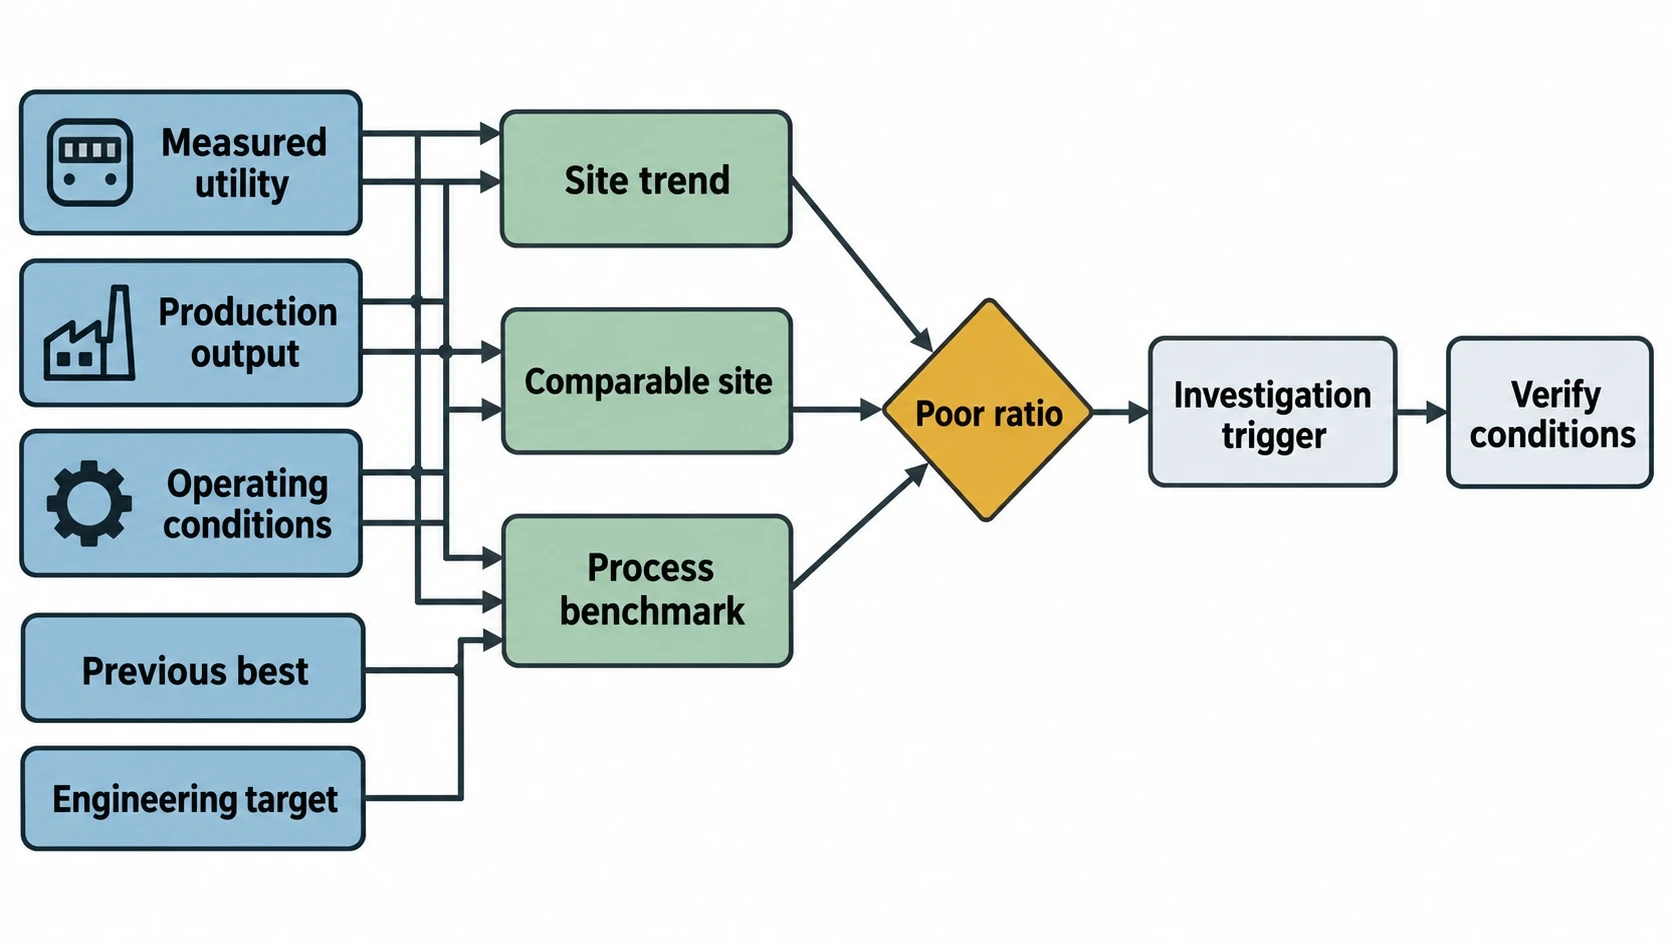
The most valuable comparison is rarely a generic sector average. It is a repeatable comparison between current performance, the site’s previous best operation and an achievable target for a defined process.
Generic food-manufacturing benchmarks have limited diagnostic value. Product moisture, recipe, packaging format, operating temperature, cleaning regime and production pattern vary sharply between factories. A frozen-food factory and an ambient bakery share a sector classification but have fundamentally different utility profiles.
Use three layers of food and beverage energy benchmarking
A practical programme uses three related comparisons.
-
Site trend benchmark
Track monthly and weekly gas, electricity and water intensity against production, operating hours and weather where relevant. This can expose deterioration after maintenance changes, control faults or revised operating practice. -
Comparable-site benchmark
Compare factories running similar equipment and products. Align meter boundaries, units, working patterns and product definitions before comparing results. -
Process benchmark
Compare a defined utility or process with its best demonstrated condition or an engineering target. This can identify excessive oven exhaust losses, avoidable refrigeration condensing pressure or high compressed-air demand outside production.
A poor ratio is an investigation trigger. Engineers should test product mix, throughput, quality requirements, maintenance condition and cleaning demand before assigning a savings figure.
Thermal benchmarks show where gas costs arise
Food plants consume gas through boilers, direct-fired ovens, fryers, dryers and thermal processing equipment. Poor performance may originate outside the main process.
A boiler can show acceptable combustion performance while the steam distribution system loses value through failed traps, poor condensate return, uninsulated valves or flash-steam discharge. An oven can have correctly adjusted burners but waste fuel during extended idle periods. Fryer exhaust may contain usable heat where an adjacent hot-water demand exists.
Useful thermal indicators include:
- Boiler gas kWh per tonne of steam generated.
- Steam supplied per tonne of saleable product.
- Condensate returned as a proportion of steam generated.
- Oven or fryer gas kWh per production hour and per tonne.
- CIP hot-water energy per verified cleaning cycle.
- Recovered heat measured against the demand it displaces.
These indicators distinguish an unavoidable low-throughput load from deteriorating efficiency. Higher gas use during a short production week may be expected; higher gas per tonne under similar conditions deserves investigation.
Electricity benchmarks reveal different operating losses
Refrigeration, compressed air, pumping and conveying equipment can run beyond production hours. A monthly electricity invoice cannot show whether a stopped line has left compressors, evaporators or pumps operating at normal duty.
Sub-metering and portable power analysis can identify:
- Refrigeration demand during production and planned idle periods.
- Compressor unloaded running and inappropriate compressed-air uses.
- Pump and fan duties suitable for variable-speed control.
- Electricity associated with a specific line, cold store or CIP circuit.
- Overnight baseload against the site’s planned idle condition.
Interval data also helps finance teams distinguish reduced consumption from changes in energy unit prices. This matters when reporting the financial outcome of a completed project.

Identify where your plant is losing energy and quantify the savings potential — our audits map every heat source, sink, and waste stream in your facility.
Build a board-ready investment case from the benchmark gap
Benchmarking earns its place in an ESOS assessment when it helps management choose and fund projects. An audit recommendation needs more than an annual kWh estimate: it needs a clear baseline, operating assumptions, delivery requirements and a method for confirming performance after installation.
Turn the performance gap into a defined opportunity
The difference between current intensity and a justified target defines the opportunity. Engineers can apply that gap to forecast production, then estimate annual energy and cost reductions using documented price assumptions.
A board paper should state:
- Production volume and product-mix basis.
- Current energy intensity, target intensity and meter boundary.
- Energy prices, standing charges and tariff assumptions.
- Capital cost, installation cost and expected production downtime.
- Maintenance implications and asset life.
- Carbon-reduction method used by the organisation.
- Food-safety, hygiene and access controls.
- Measurement and verification period after implementation.
This distinguishes a low-cost repair from a major capital project. Burner tuning, insulation repairs and compressed-air leak repairs may suit rapid approval. Boiler replacement, heat recovery and major refrigeration work need longer financial appraisal and a planned outage.
Use financial measures that fit the asset decision
Simple payback can screen smaller projects. It is less suitable as the sole decision measure for long-life assets.
Net present value and internal rate of return help compare projects with different capital costs, operating lives and savings profiles. They are particularly relevant to refrigeration upgrades, boiler replacement, heat recovery and oven modifications.
Baseline quality affects every financial measure. A baseline drawn from an unusually poor month can exaggerate savings. One that ignores a new product with a longer cooking time can overstate the likely improvement. A representative 12-month record, supported by production data and defined meter boundaries, reduces both risks.
Measurement and verification protects claimed savings
The project team should agree the baseline before work begins. It should record variables that may change, including production volume, product mix, ambient conditions, operating hours and cleaning frequency.
After implementation, the team should compare performance using the same meter boundary and production denominator. Where a project affects several systems, the review should separate its effect from unrelated changes in output or operating conditions.
This supports Phase 4 reporting on energy savings achieved during the compliance period and gives engineering and finance teams an agreed record of whether a project delivered the result used in its approval case.
Establish a practical programme before ESOS notification
A factory does not need complete permanent sub-metering before it starts benchmarking. It needs reliable main-meter data, a clear production record and controlled definitions.
Begin with a verified baseline
Collect at least 12 months of electricity and fuel records, half-hourly electricity data where available, on-site generation data and production totals. Reconcile invoices with meter readings. Record estimated invoices, missing intervals and changes in meter configuration.
Map energy from incoming supplies through utility generation and distribution to major processes. Portable power analysers, ultrasonic leak detectors and thermal imaging can fill defined evidence gaps during a site survey.
Keep the operating KPI set small
A long KPI register soon becomes an administrative exercise. Select ratios that represent significant energy consumption and lead to decisions.
A bakery might begin with gas kWh per tonne of saleable product, oven gas kWh per tonne by product family, site electricity kWh per tonne, compressed-air electricity during non-production hours and boiler gas per tonne of steam.
A dairy may focus on pasteurisation, refrigeration, CIP and hot-water demand. A beverage site may give greater weight to compressed air, filling lines and refrigeration. Definitions must remain stable so operators can compare one week or month with the next.
Apply a seven-step audit structure
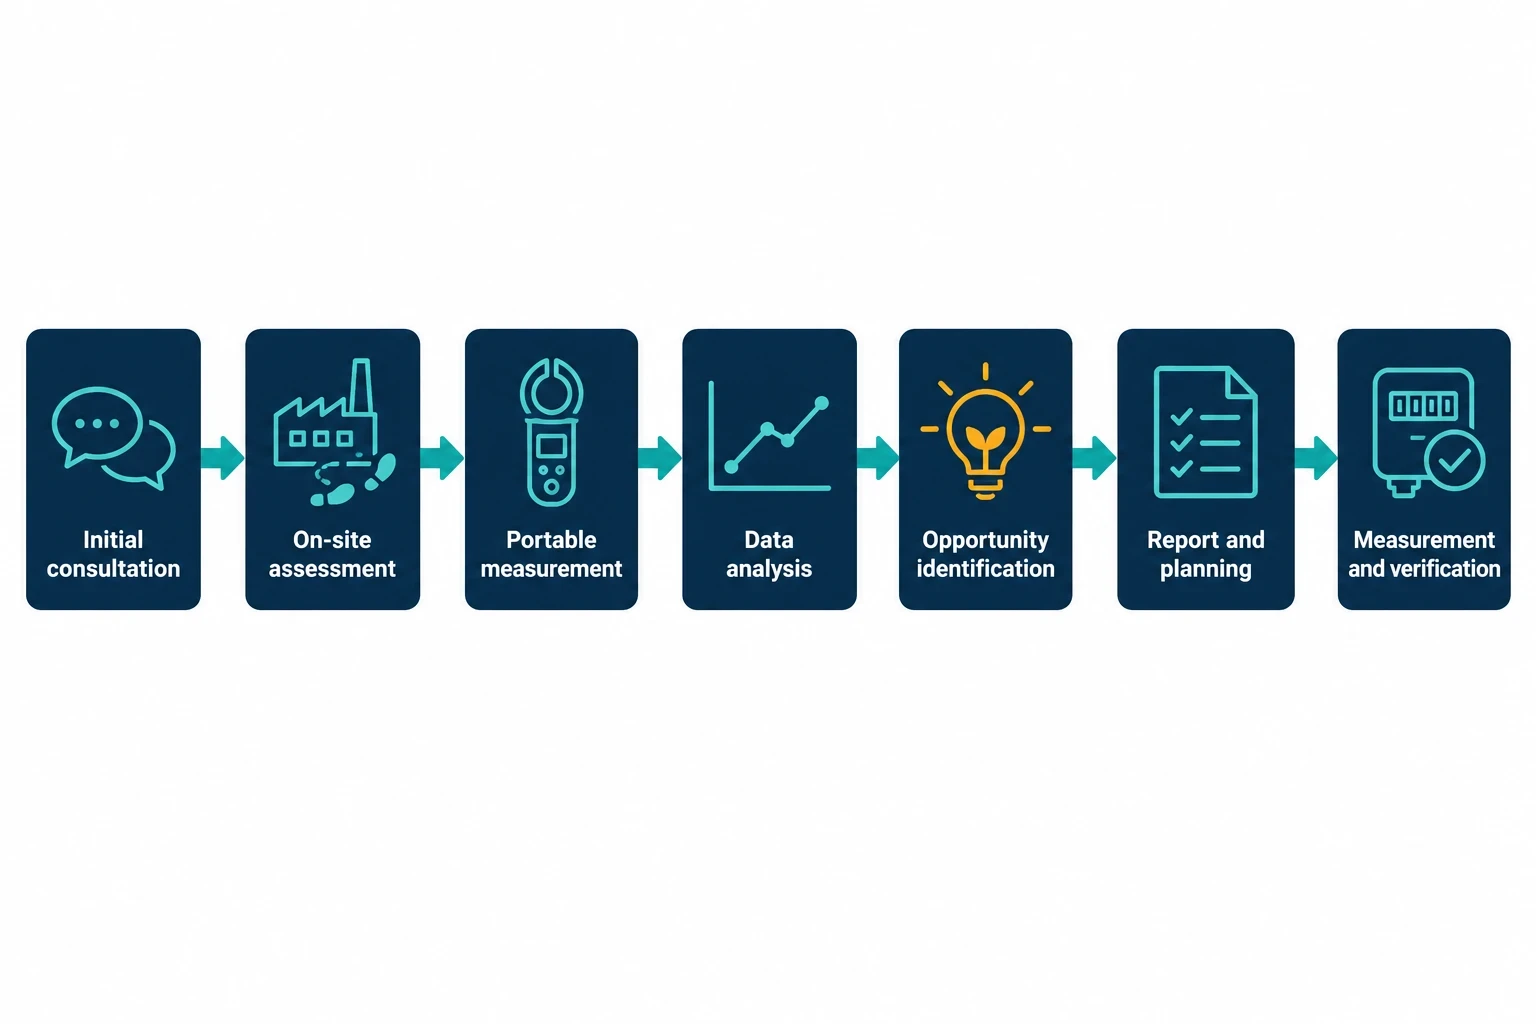
EnerTherm Engineering’s seven-step audit methodology can organise the work into initial consultation, on-site assessment, portable-instrument measurement, data analysis, opportunity identification, report preparation with implementation planning, and ongoing measurement and verification.
For food factories, the programme should account for hygiene controls, allergen segregation, restricted access and production schedules. The audit plan should define measurement locations, isolation requirements, access permissions and production data before instruments arrive on site.
Benchmarking turns ESOS data into operating decisions
Meaningful energy-intensity ratios and coverage of significant energy consumption give sustainability, engineering and finance teams a shared basis for identifying losses, appraising projects and verifying results.
This article reflects the independent analysis and editorial opinion of EnerTherm Engineering. Product names, trademarks, and brands mentioned belong to their respective owners. EnerTherm Engineering is not affiliated with, endorsed by, or a licensee of any third-party software or product mentioned unless explicitly stated.

Simulation Engineer — EnerTherm Engineering
Rajesh Sekar is a Simulation Engineer at EnerTherm Engineering, specialising in computational fluid dynamics (CFD), finite element analysis (FEA), and thermal process simulation. He holds a degree from Cranfield University and brings extensive experience in simulation-based product development from the automotive, aerospace, and energy sectors.
