How Mass and Heat Balance Models Expose Plant Losses
A process model for tracing utilities, losses and constraints before investment.
A mass and heat balance is an engineering model that accounts for material and energy entering, leaving, accumulating within and lost from a defined process boundary.
A plant may have reliable production figures, utility bills and historian trends, yet still lack an answer to the basic question: where is the loss? Steam demand rises, yield falls, effluent load changes or a dryer becomes a bottleneck. Each symptom points to a different cause. A properly built mass and heat balance turns those observations into a quantified process picture.
For UK process engineers, this matters beyond energy accounting. The same model can identify product losses, water use, emissions routes, utility constraints and hidden capacity limits. It provides evidence before operating conditions change, heat-recovery equipment is specified or capital is committed to a debottlenecking project.
What a mass and heat balance model measures
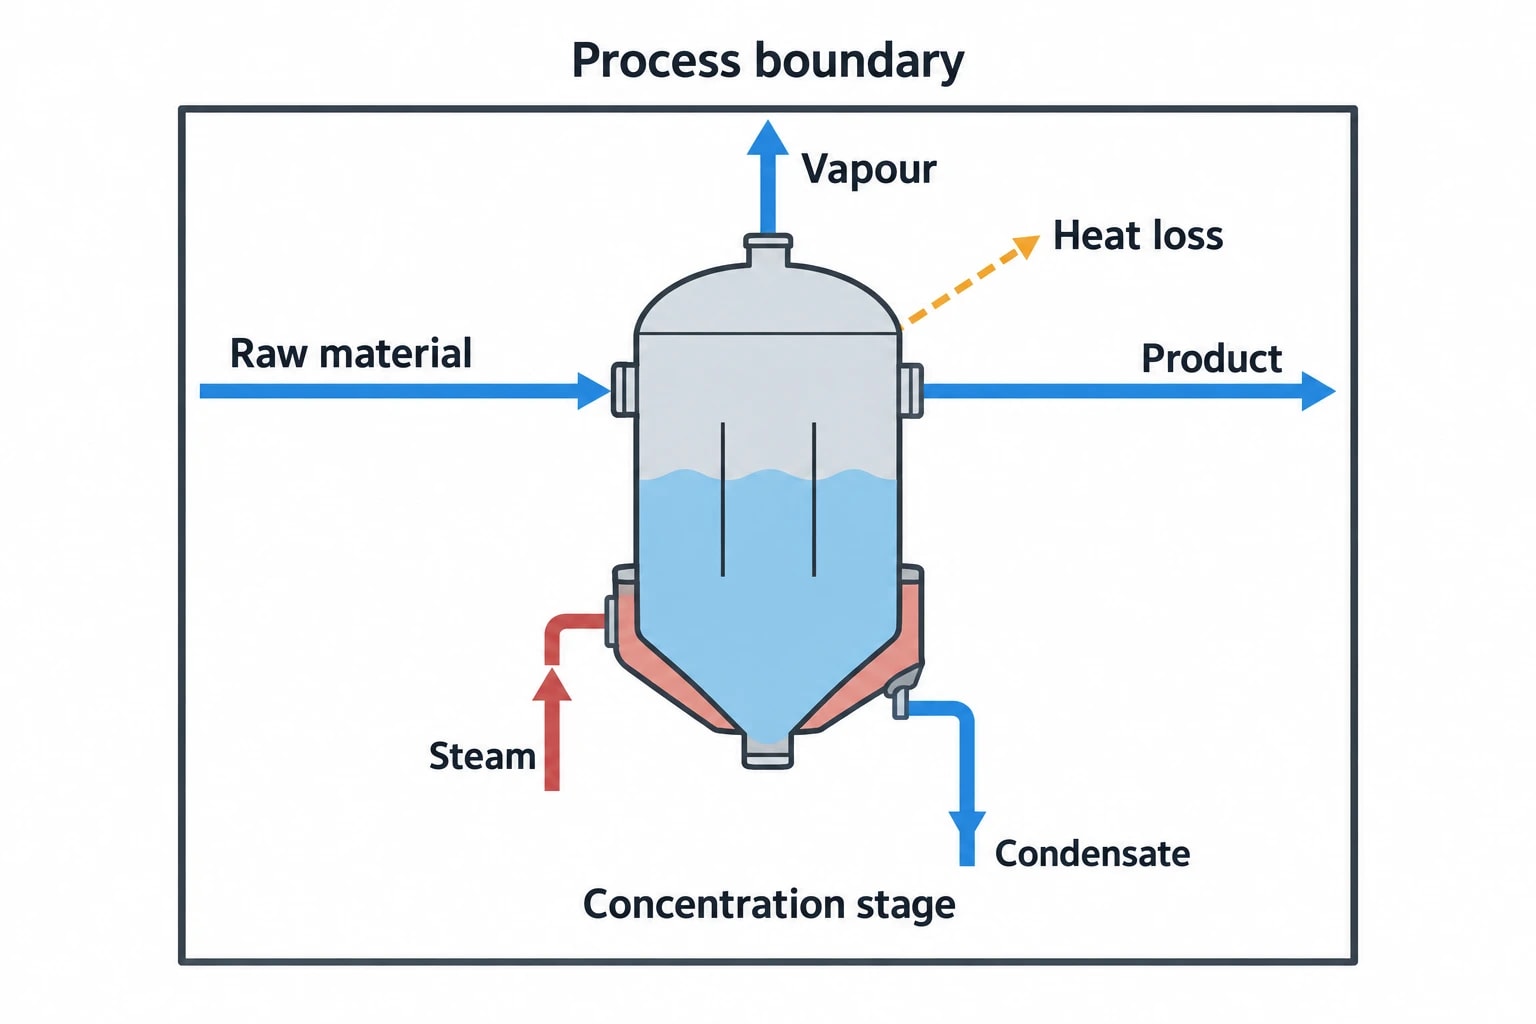
A mass and heat balance begins by setting a clear boundary around a process, from a single heat exchanger or evaporator to an entire production line. Engineers then account for all streams that cross that boundary and all significant energy transfers.
The mass side of the model
The mass balance records the flow, composition, phase and condition of each relevant stream. Depending on the process, this may include:
- Raw materials and intermediate product
- Water, process air and cleaning media
- Steam condensate and boiler-feedwater returns
- Solvents, reagents and catalysts
- Product, by-product, purge and waste streams
- Vapour, vent, drain and effluent discharges
A total mass balance can reveal that more material leaves a unit than recorded product and waste figures explain. A component balance takes the investigation further. It can distinguish a genuine product-yield problem from dilution, evaporation, entrainment, unmeasured purge flow or a faulty instrument.
In a food plant, a balance around a concentration stage may separate water removed as vapour from solids leaving with condensate or carried over to a vapour system. In a chemical process, it can distinguish reactant loss from incomplete conversion. In pulp and paper, it can quantify fibre losses to white water or rejects. These are commercial questions as much as technical ones.
The heat side of the model
The heat balance tracks energy delivered, transferred, retained and rejected. Typical terms include fuel input, imported electricity, steam, thermal oil, cooling water, refrigeration duty, product sensible heat, latent heat, reaction heat and heat loss from equipment surfaces.
The model should describe conditions at stream level rather than treating a monthly gas bill as the process heat input. Steam pressure, condensate condition, feed temperature, product moisture and exhaust-air humidity can each change the result substantially.
A heat balance exposes a mismatch between utility consumption and useful process duty. That mismatch may arise from radiation and convection losses, blowdown, flash steam, excessive exhaust temperature, poor condensate return, air ingress, bypassed heat recovery or operation at a duty far below design.
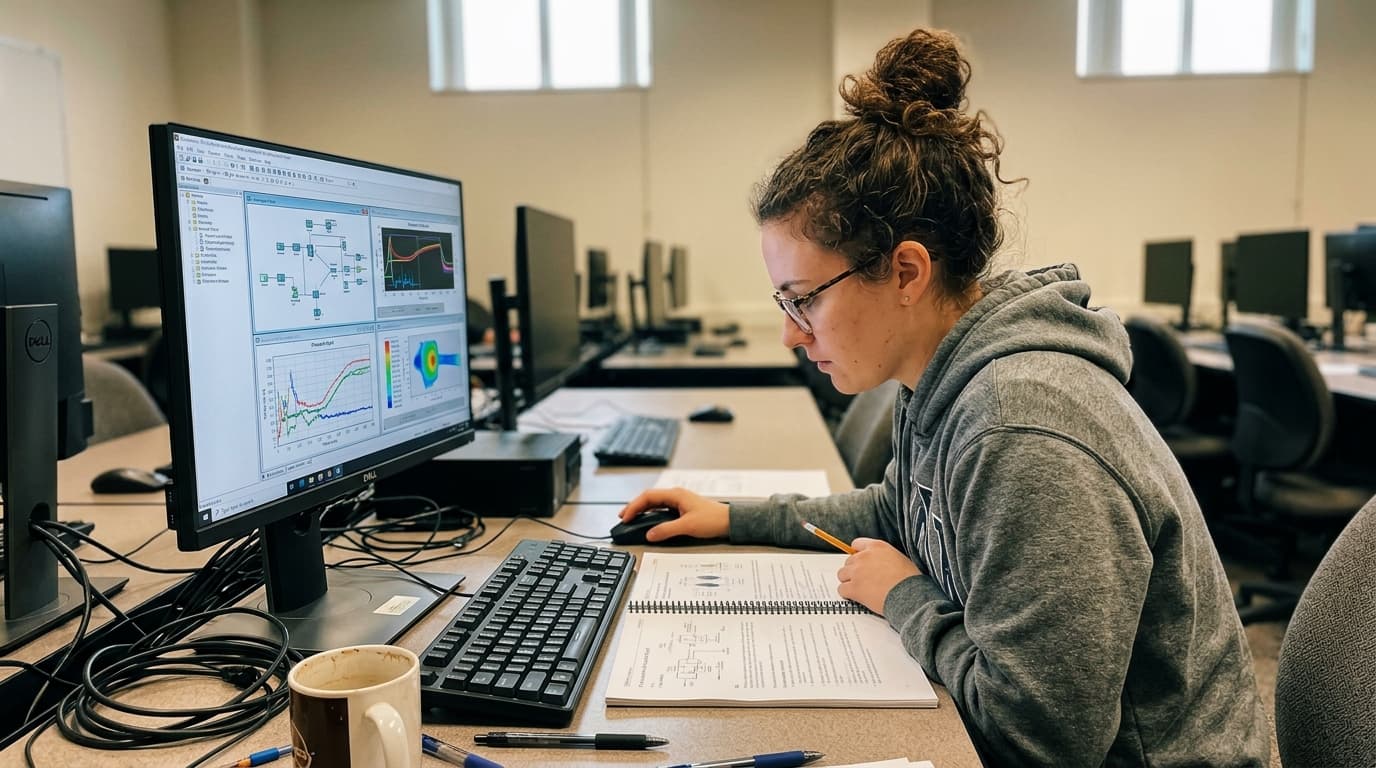
Map every energy and material flow in your process with detailed heat and mass balance calculations — the foundation for any optimisation or design project.
Why balance closure comes before improvement projects
A balance model becomes useful when the numbers close within an agreed, technically defensible tolerance. Closure does not mean forcing inputs and outputs to match. It means reconciling measured data, known uncertainty and physical constraints so that the remaining difference has an explanation.
Bad data can look like a plant problem
An apparently large loss may originate in the data set. Common causes include a flowmeter installed outside its reliable range, a temperature sensor with poor contact, a density assumption applied to changing product, unmetered clean-in-place water or historic laboratory results paired with current plant flow data.
A credible model therefore documents:
- The operating period represented by the balance.
- The selected process boundary and excluded streams.
- Tag numbers, data sources and sampling intervals.
- Assumptions about composition, phase and thermodynamic properties.
- Instrument condition, calibration status and estimated uncertainty.
- The reconciliation method and residual imbalance.
This discipline stops teams from treating one production shift as representative of a full campaign. It also prevents an attractive savings calculation from resting on incompatible operating data.
Establish the operating case first
Plants rarely operate at a single condition. Batch sequence, product grade, ambient temperature, fouling state, throughput and cleaning requirements all affect the balance.
A steady-state balance can be appropriate for a continuous process operating at a stable production rate. A batch reactor, retort, clean-in-place system or thermal treatment line often needs time-resolved data. In those cases, the model must capture accumulation in vessels, temperature ramps, filling and emptying, and changes in steam demand through the cycle.
The operating case should state the throughput, product specification, utility pressure and relevant constraints. A model based on a low-rate weekend run may identify a different priority from one based on a fully loaded weekday shift.
How heat and mass balances reveal plant losses
A balance does not label a loss as waste automatically. It places the loss in a measurable stream, assigns it a quantity and shows its relation to the process objective. Engineering judgement can then begin.
Product, moisture and material losses
Unaccounted solids are often the highest-value finding. They can appear in filtrate, wash water, off-spec product, dust collection, vapour condensate or drainage systems. A component-level balance identifies the loss route and distinguishes it from a stock-record discrepancy.
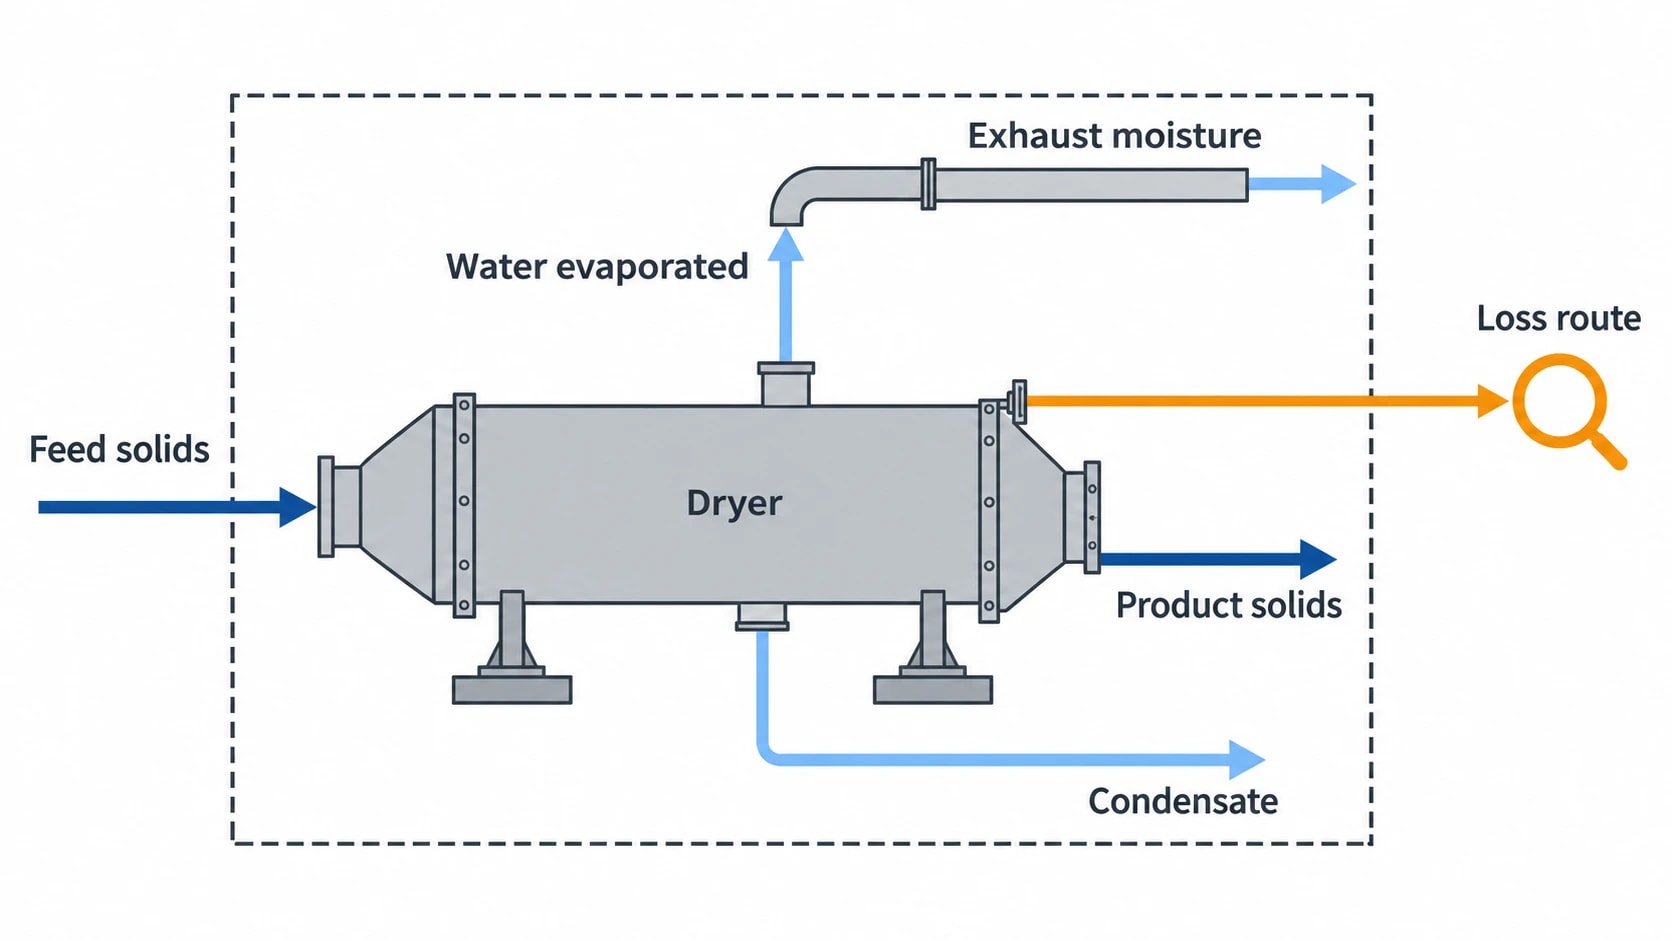
Dryers and evaporators provide a clear example. The model can compare feed solids, product solids, water evaporated, exhaust moisture and condensate. If the figures do not align, engineers can inspect likely routes such as leaks, false-air infiltration, carryover, inaccurate moisture measurement or a diverted side stream.
For food and beverage sites, product quality cannot be separated from thermal performance. Retained Regulation (EC) No 852/2004 requires food business operators to establish, implement and maintain procedures based on HACCP principles. Its heat-treatment provisions for food in hermetically sealed containers require checks of relevant heat-treatment parameters. A balance model can support the technical understanding behind those controls, but it does not replace validated process limits, microbiological verification or HACCP records.
Steam, condensate and heat-recovery losses
Steam systems frequently appear efficient at boiler-house level while wasting useful enthalpy across the process area. A heat balance can locate the loss by examining steam supplied, condensate recovered, condensate temperature, flash steam, blowdown and final heat rejection.
Useful questions include:
- Does the process require the supplied steam pressure?
- Is the condensate returned, discharged or mixed into effluent?
- Does flash steam have a usable lower-pressure demand?
- Are heat exchangers achieving the expected outlet temperatures?
- Does a vent or stack carry recoverable heat?
- Has fouling increased the temperature approach and prolonged heating time?
A falling condensate-return temperature can signal greater flash loss, cold-water contamination, a failed steam-trap arrangement or a new discharge route. The balance does not establish the root cause alone, but it directs investigation towards the stream where value is leaving.
Losses caused by air, water and unwanted dilution
Many utility losses enter the process as extra mass rather than directly as wasted heat. Air infiltration into a dryer raises the volume of gas that fans must move and may change exhaust conditions. Cooling-water leakage into a product system can increase evaporation duty. Excess rinse water can dilute a batch, extend heating time and increase effluent volume.
A combined model catches these interactions. The mass balance identifies the additional water or air. The heat balance quantifies the duty needed to heat, evaporate or cool it. Separate water and energy studies can otherwise miss the combined cost of poor process control.
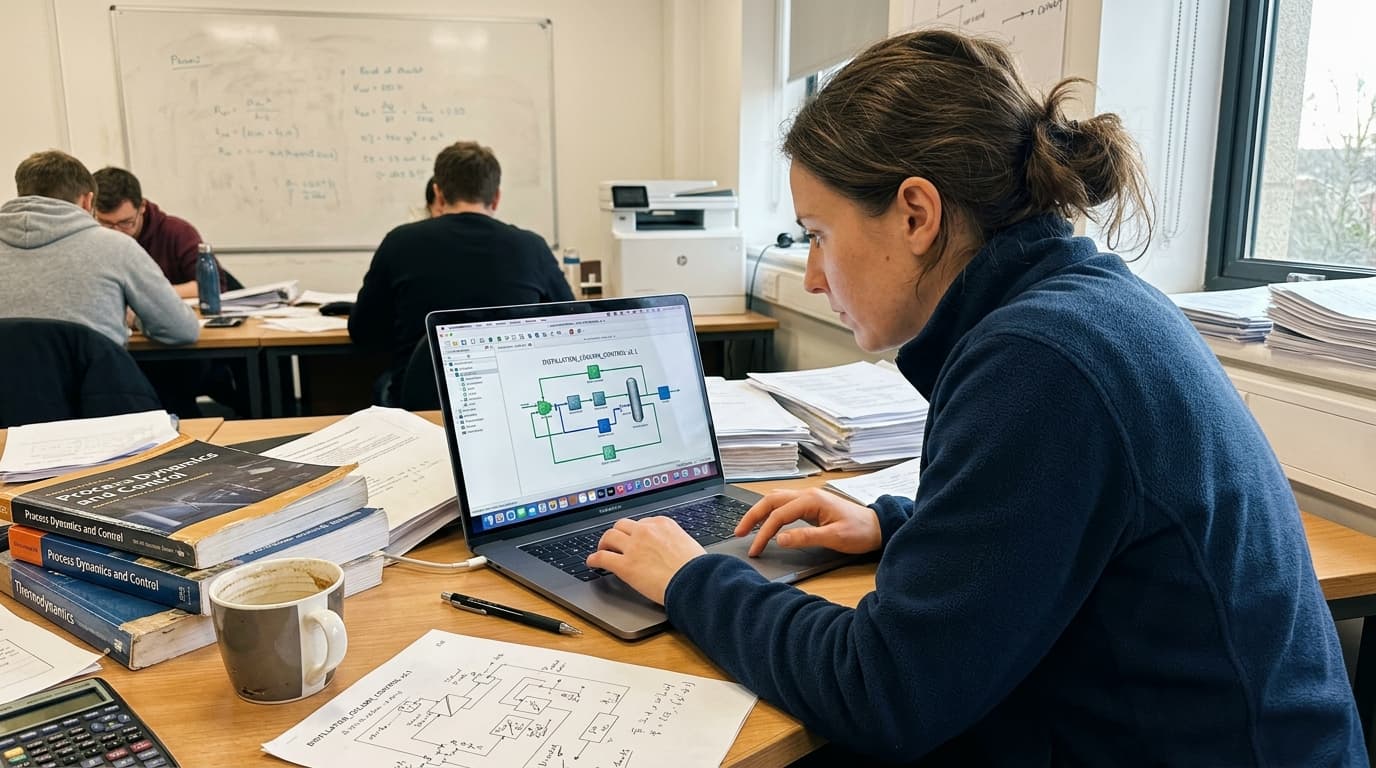
Map every energy and material flow in your process with detailed heat and mass balance calculations — the foundation for any optimisation or design project.
A practical workflow for building a defensible model
The strongest models develop from plant evidence, not a flowsheet alone. Piping and instrumentation diagrams, process flow diagrams, operating procedures, laboratory results, historian records, utility invoices and operator knowledge each contribute a different part of the picture.
Define boundaries and required decisions
Start with the decision that the model must support. A dryer study may seek the cause of high specific energy use. An evaporator study may investigate capacity. A site-wide utility study may compare heat-recovery and carbon-reduction opportunities.
Then define the boundary around the heat exchangers and utilities that influence that decision. Broad boundaries can obscure local causes. Boundaries drawn too tightly can omit the streams that explain them.
The resulting process flow diagram should contain stream numbers, conditions, flow rates, compositions and energy terms. It becomes a single source of truth when engineering, operations and energy teams agree on its basis.
Gather data where it changes the conclusion
More data is not necessarily better data. A measurement campaign should target the variables that dominate uncertainty or determine the size of an opportunity.
For a heat exchanger, this normally includes both flow rates, inlet and outlet temperatures, pressure where phase change is possible, and fluid composition where properties vary. For drying equipment, feed rate, feed moisture, product moisture, inlet and exhaust-air conditions, fuel or steam use, and fan power are likely to matter.
Short-term clamp-on flow measurement, condensate tests, stack measurements and targeted laboratory analysis can fill gaps where permanent instrumentation does not exist. Plant teams should record mode changes and abnormal events during the survey, since a balance built from an unrepresentative period can mislead a capital decision.
Reconcile, challenge and validate
Engineers should reconcile the model against plant observations. Does predicted steam demand resemble the steam-meter reading? Does the calculated product inventory fit tank-level changes? Does the model reproduce expected effects when throughput changes?
Validation should include a walkdown. A drawing may show a closed condensate route that operators have bypassed. A historian trend may not show a manually operated drain. A heat exchanger marked as available may have been isolated for months.
Industry-standard simulation platforms including Aspen Plus, HYSYS and DWSIM can support complex phase behaviour, reaction systems and integrated process models. The platform does not make weak data reliable. The process boundary, property method, inputs and validation evidence still determine whether the result can support a decision.
Turning a balance into an improvement plan
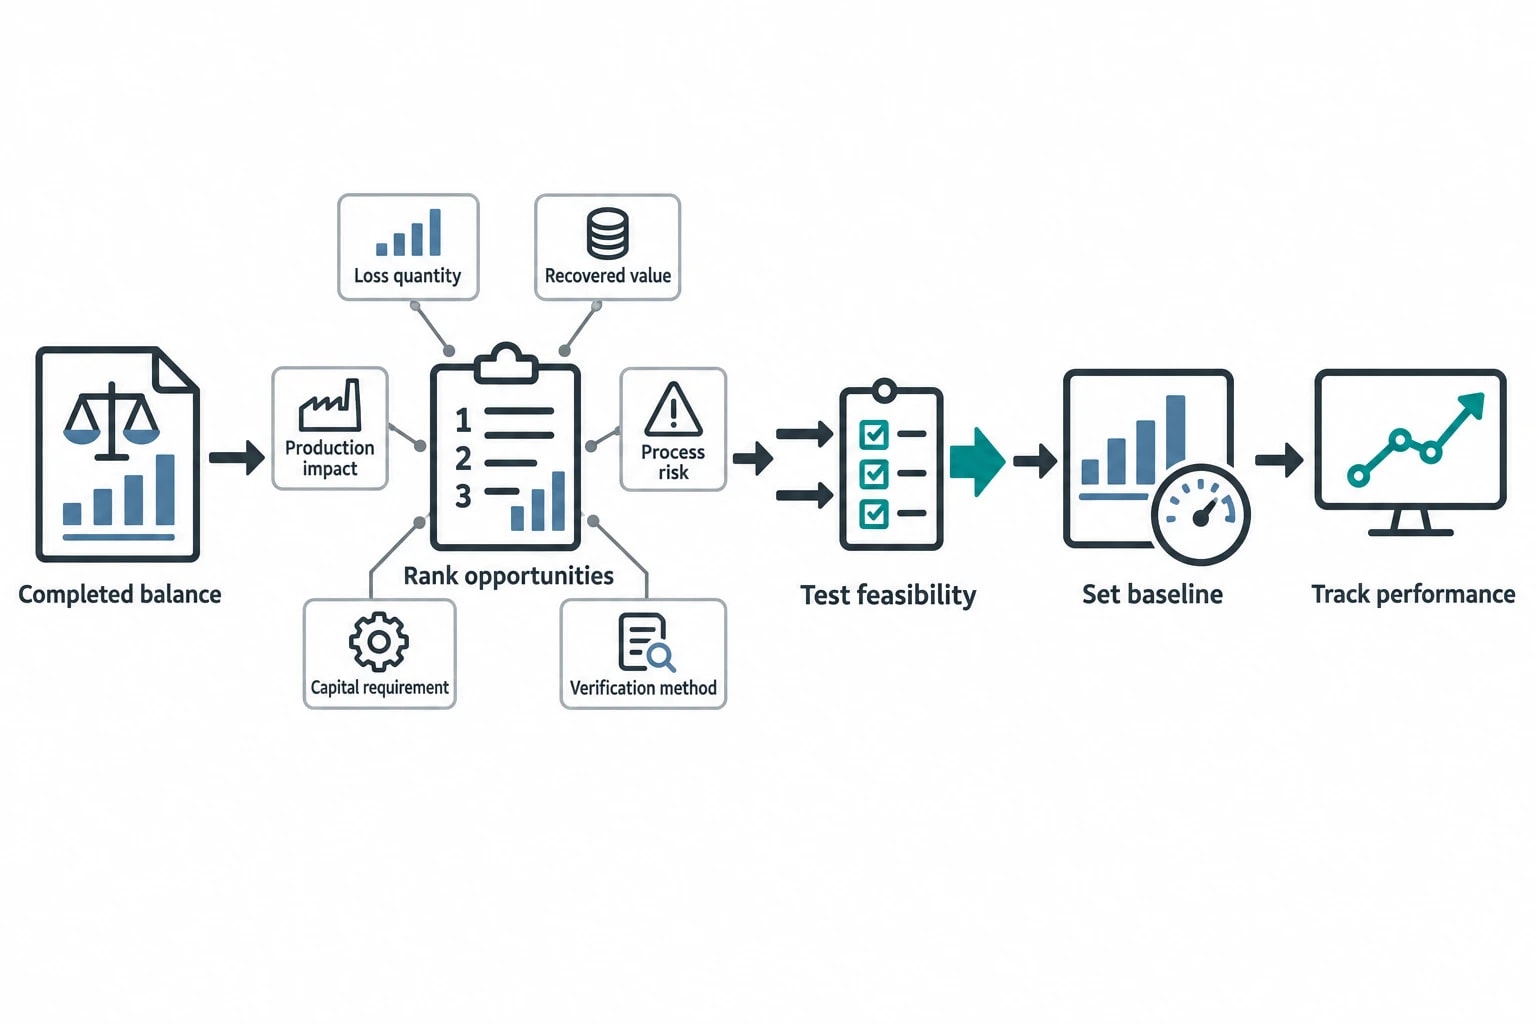
A completed balance should lead to a ranked set of actions rather than a large spreadsheet. Rank opportunities by the quantity of loss, the value of recovered product or energy, impact on production, process risk, capital requirement and verification method.
Separate no-cost fixes from capital projects
Operational changes may include correcting excess air, restoring condensate return, reducing avoidable dilution, repairing insulation, improving batch sequencing or resetting a utility pressure where process limits permit.
Capital opportunities may include heat-exchanger cleaning or replacement, vapour recompression, flash-steam recovery, exhaust heat recovery, additional metering, dryer controls or revised heat-integration arrangements. The balance provides the duty and stream conditions that designers need to test feasibility.
Each proposal needs a baseline. Use a relevant energy performance indicator such as energy per tonne of saleable product, steam per batch, water per tonne of product or heat duty per kilogram of water removed. Production mix, ambient conditions and quality constraints must sit alongside the indicator, otherwise an apparent improvement may be a change in operating conditions.
Support permits, audits and investment cases
ISO 50002-3:2025 provides process-specific guidance for energy audits using the framework in ISO 50002-1:2025, and identifies energy-balance modelling, benchmarking and performance tracking as useful elements of process auditing. ISO 50001:2018 remains the current energy management system standard following its 2024 confirmation.
For England’s Part A(1) permitted installations, Environment Agency guidance requires operators to demonstrate energy-efficiency measures and points to ISO 50001 or techniques in the Reference Document on Best Available Techniques for Energy Efficiency. A documented heat and mass balance is practical evidence for that conversation. It shows the boundary, data, losses, constraints, assumptions and technical basis for selected actions.
The same evidence improves investment quality. A proposed heat-recovery scheme should show the source duty, temperature profile, timing, contamination risk, receiver demand and expected operating range. The balance identifies whether the heat is genuinely available at the time and temperature required, rather than merely appearing as a large annual total.
What a good model leaves behind
The immediate value of a mass and heat balance is visibility. It makes losses observable in units that operations, finance and engineering can discuss together. Its longer value is a maintained technical baseline.
An effective handover includes an agreed process flow diagram, embedded stream tables, reconciled mass and energy balances, a clear list of assumptions, an energy map and a verification plan for selected actions. As product grades, equipment condition and utility arrangements change, the model can be updated rather than rebuilt from scratch.
This article reflects the independent analysis and editorial opinion of EnerTherm Engineering. Product names, trademarks, and brands mentioned belong to their respective owners. EnerTherm Engineering is not affiliated with, endorsed by, or a licensee of any third-party software or product mentioned unless explicitly stated.

Managing Director — EnerTherm Engineering
Dr. François Pierrel is Managing Director of EnerTherm Engineering with over two decades of expertise in thermal design, heat transfer, and industrial energy optimisation. He holds a PhD in Heat Transfer from Cranfield University and a Post-Doctorate from Heriot-Watt University.
