
Why Energy Balance Analysis Finds Hidden Process Losses
How ESOS Phase 4 and ISO 50001 quantify industrial energy use before 5 December 2027.
Energy balance analysis accounts systematically for energy entering, leaving, accumulating within and being lost from a defined industrial process. For UK organisations in scope of ESOS Phase 4, it has immediate regulatory weight: significant energy consumption must cover at least 95% of total energy consumption, with compliance notification due by 5 December 2027.
Plant utility meters show what a site buys. They rarely show where energy performs useful work, leaves with a product or exhaust stream, or disappears through poor control. Energy balance analysis closes that gap. It turns fuel, steam, electricity, chilled water, compressed air and process streams into an accountable picture of energy use.
That picture improves plant decisions. A boiler fuel bill may suggest that steam generation needs attention. A process energy balance can show that the larger opportunity sits downstream: flash steam vented from condensate, a dryer exhausting hot humid air, an oversized cooling load, a heat exchanger bypass, or a batch vessel held at temperature while production waits.
For process engineers, energy managers and improvement leads, the value lies in separating measured consumption from useful duty and avoidable loss.
What energy balance analysis measures

An energy balance starts with a boundary. The boundary might surround a single heat exchanger, dryer, batch reactor, distillation column, utility island or the entire production site. Engineers then identify each energy and material stream crossing it.
The analysis considers several forms of energy:
- Fuel chemical energy entering a boiler, furnace or thermal oxidiser.
- Electrical energy supplied to motors, drives, compressors, refrigeration plant and resistance heaters.
- Enthalpy carried by steam, condensate, hot water, refrigerants, process liquids, gases and solids.
- Sensible heat associated with temperature change.
- Latent heat associated with evaporation, condensation, melting or drying.
- Heat rejected to cooling water, air, effluent, vents and the plant fabric.
- Energy accumulated in equipment or inventory during start-up, shutdown and batch operations.
A steady-state balance suits processes where flows and temperatures remain sufficiently stable over the review period. Many continuous chemical, refining and pulp processes can be assessed this way once operating data have been screened for changes in rate, grade and operating mode.
Batch processes need different treatment. A pharmaceutical reactor, food retort or mixing vessel may spend substantial time heating, holding, cooling, cleaning and waiting. Energy input cannot be judged against production volume alone without allocating it across the batch sequence. A dynamic balance tracks changing inventory and temperature over time, exposing heat losses during hold periods and utility demand that persists between batches.
The method does not create energy savings by itself. It establishes the evidence needed to identify which losses matter and whether an apparent saving shifts energy demand elsewhere.

Map every energy and material flow in your process with detailed heat and mass balance calculations — the foundation for any optimisation or design project.
Why site-level data misses hidden process losses
Utility bills aggregate unlike duties
A monthly gas invoice includes boiler losses, distribution losses, venting, process heating, cleaning, standby demand and variations in production. Electricity consumption combines useful shaft work with throttling, idling, cooling penalties and heat rejection from refrigeration.
Those totals are necessary for cost control but too coarse for diagnosis. A balance begins where energy enters a process and follows it to its final destination.
Consider a food drying line. The gas meter can confirm consumption. It cannot distinguish product moisture removal from excess exhaust temperature, false-air ingress, over-ventilation, uninsulated ducting or unnecessary recirculation-fan power. Measuring fuel, air flow, inlet and outlet temperature, humidity, product throughput and moisture content allows engineers to quantify the dryer’s evaporation duty and identify the remainder.
The same principle applies to a distillation column. Reboiler steam may be within its usual range, yet condenser cooling-water flow can be high because reflux, feed condition, pressure or fouling has changed. A column-level energy balance places those variables in one calculation and reveals whether extra steam produces separation, compensates for an upstream change or is lost through inefficient operation.
Reconciled streams expose implausible measurements
Plant instruments do not agree perfectly. Flowmeters drift. Steam meters may be poorly compensated. Temperature sensors sit in poor locations. Batch records contain gaps. A balance gives engineers a disciplined way to test the data rather than accepting each instrument at face value.
If total enthalpy entering a defined boundary differs materially from total enthalpy leaving it, after allowance for known losses and inventory change, the team has a problem to resolve. The cause may be a missing stream, incorrect composition, an unmeasured bypass, poor meter calibration or a boundary drawn around the wrong equipment.
This is a productive result. A calibrated steam meter, corrected condensate-return flow or confirmed process flow often changes the ranking of investment options.
Losses are frequently distributed across interfaces
The most expensive loss is often not inside a single asset. It sits at an interface:
- Condensate-return temperature drops across a long, uninsulated route.
- A heat exchanger network rejects heat because process timing prevents recovery.
- A hot product stream is cooled before another stream is heated elsewhere on site.
- A refrigeration system removes heat added by excessive hot-water use.
- Boiler pressure remains high to satisfy one poorly controlled user, increasing distribution and flash losses across the network.
An energy balance follows heat across those interfaces. Asset-efficiency tests generally do not.
The process losses an energy balance brings into view

Exhaust, vent and stack losses
Hot exhaust streams hold recoverable energy only if the temperature level, contamination risk, corrosion risk and operating pattern support a practical recovery route. A balance quantifies sensible and latent heat in the stream before anyone proposes a heat exchanger.
This matters in dryers, ovens, kilns, furnaces and boilers. Exhaust temperature alone is incomplete evidence. Mass flow, moisture content, oxygen concentration where combustion is involved, production rate and inlet-air condition shape the actual loss.
In food and pharmaceutical production, exhaust recovery must also respect hygiene, allergen segregation and cleanability requirements. A balance identifies the available duty; process safety and quality constraints determine which recovery arrangement is acceptable.
Cooling loads that hide upstream waste
Cooling water, glycol and refrigeration systems often receive less scrutiny than fired equipment. Yet cooling duty represents heat that the plant first introduced or failed to recover.
A high condenser load in a refinery, chemical plant or refrigeration system may arise from a legitimate separation or cooling requirement. It may also reflect hot-feed bypassing, over-condensation, an unnecessary trim cooler, a control valve passing steam, poor insulation or a process operating away from its intended temperature approach.
The balance should follow heat from the source to the cooling utility. This prevents a common error: reducing chiller electricity without addressing the process heat that created the load.
Steam, condensate and flash losses
Steam systems reward clear boundaries. Steam supplied to a user has a measurable enthalpy. Condensate returning from that user has another. The difference should align with useful process duty, losses and any flashing or venting.
A large gap can point to leaking steam traps, open drains, unmetered users, condensate contamination, failed level control or flash steam released without a receiver or recovery user. The source of a loss can vary with production rate, making trend data valuable alongside an operating-point balance.
Condensate also carries heat and treated-water value. Returning it at the highest practical temperature and pressure reduces boiler make-up and fuel demand, subject to contamination risk and boiler-water chemistry controls.
Heat exchanger underperformance
Heat exchangers are central to energy recovery and frequently sit behind hidden losses. Fouling, bypassing, incorrect flow distribution, changed fluid properties, damaged internals and altered process temperatures can reduce heat transfer or increase pressure drop.
A balance across each side of the heat exchanger tests whether the heat released by the hot stream matches the heat received by the cold stream within measurement uncertainty. It also identifies the duty shortfall. That creates a sound basis for deciding between cleaning, redesign, control changes, additional area or a wider heat-integration study.
Standby, hold and changeover energy
Production schedules can turn a well-designed process into a poor energy performer. Heated tanks held ready for a delayed batch, conveyors running between orders, steam headers left pressurised during shutdown, and clean-in-place systems operated on fixed time rather than a verified end point can create substantial consumption without corresponding output.
Energy balance analysis makes this visible when tied to operating states rather than monthly averages. The relevant comparison may be energy per batch phase, per tonne of water evaporated, per tonne of saleable product, or per hour in a defined standby condition.
A practical energy balance analysis workflow
A credible analysis depends on method as much as mathematics. The following sequence keeps the work grounded in plant operation.
-
Set the decision and boundary. Define whether the objective is utility reduction, heat recovery, capacity release, emissions reduction, compliance evidence or a specific process problem. Select boundaries that isolate the decision.
-
Build the stream list. Use P&IDs, process flow diagrams, utility drawings, production records and operator knowledge to identify all material and energy crossings. Include bypasses, vents, drains, recirculation loops and intermittent cleaning services.
-
Select representative operating cases. A single snapshot is rarely enough. Choose stable cases by grade, throughput, season, ambient condition, batch stage or campaign. Record operating constraints and equipment status.
-
Collect and validate data. Capture flows, pressures, temperatures, compositions, utility use, product moisture and production rate. Confirm meter locations and units. Reconcile conflicting data against physical conservation.
-
Calculate duty and losses. Convert streams to a common energy basis, distinguish useful duty from rejected heat and identify uncertainty. Use measured properties and credible thermodynamic data for the actual materials present.
-
Test improvement cases. Model operational changes before capital proposals. These might include lower steam pressure, altered temperature targets, condensate recovery, revised heat-exchanger sequencing, reduced excess air or a different batch schedule.
-
Translate findings into decisions. Rank opportunities by energy, carbon, production impact, safety, quality risk, capital cost, operability and maintenance requirement. Document assumptions so the site can verify results after implementation.
EnerTherm Engineering’s Heat and Mass Balance work applies an 11-step methodology from data acquisition through validated steady-state or dynamic simulation. The final deliverable should provide a process flow diagram with stream tables, a validated mass and energy balance, and an energy map that makes loss locations and recovery options visible.
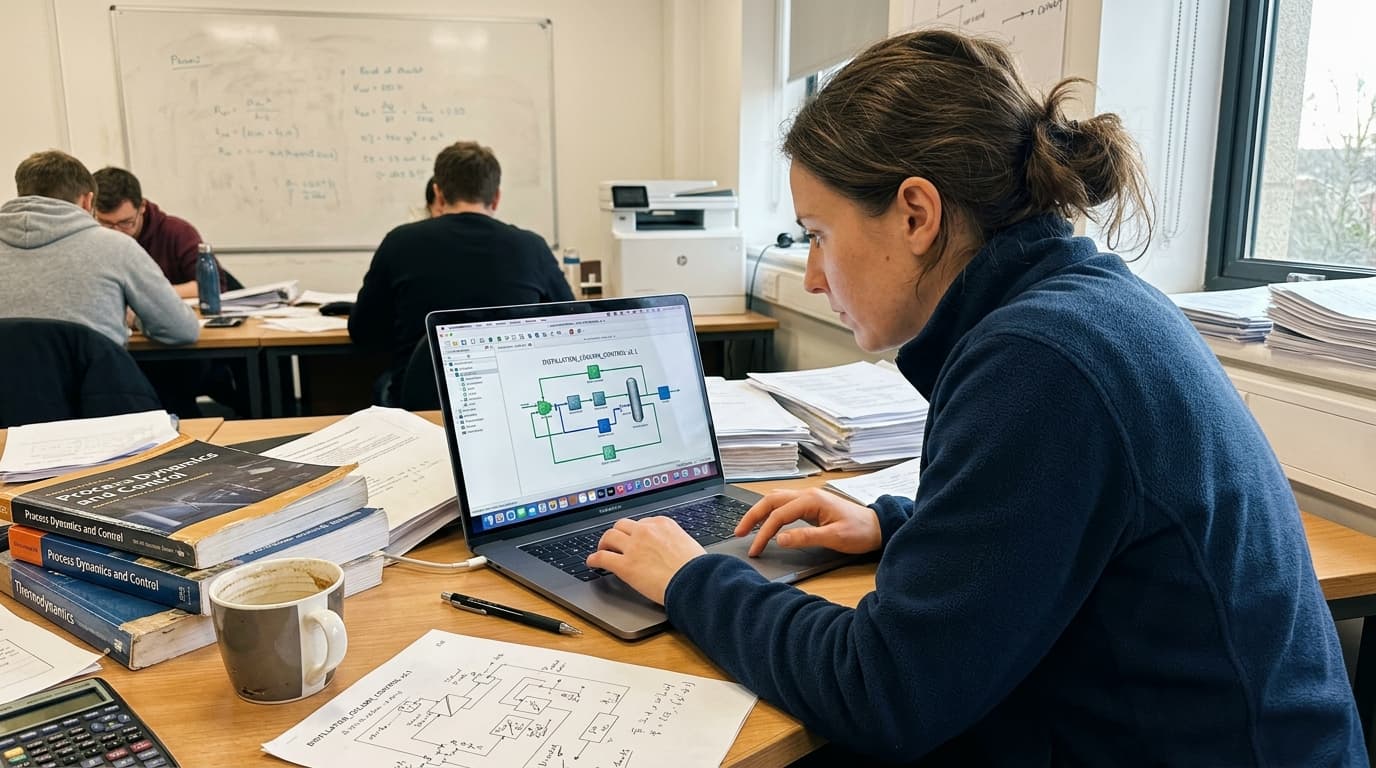
Map every energy and material flow in your process with detailed heat and mass balance calculations — the foundation for any optimisation or design project.
How energy balance analysis supports debottlenecking
Energy efficiency and production capacity often meet at the same constraint. A process limited by a reboiler, dryer, evaporator, chiller or heat-exchanger network cannot be assessed using utility intensity alone.
Distinguishing a heat-transfer limit from a utility limit
A dryer may appear short of gas-firing capacity. An energy balance can show that the real restriction is exhaust handling, fan capacity, recirculation rate, product-feed moisture or poor heat transfer. Adding burner capacity would then add fuel without releasing the intended throughput.
Similarly, a batch reactor might have enough installed heating duty but spend too long reaching temperature because steam pressure collapses during simultaneous demand elsewhere. The balance needs to encompass both the reactor and the steam-distribution condition that affects it.
Avoiding savings that move the constraint
Reducing steam use by lowering a process temperature may lower utility demand but lengthen reaction, drying or cleaning time. Raising heat recovery can reduce boiler load yet increase pressure drop or create fouling exposure. A proper balance presents these trade-offs alongside mass flow, temperatures and production rate.
Balance work should connect operations, maintenance, process safety, quality and energy teams. The technical answer must work in normal production, not only in a calculation file.
Energy balance analysis for UK and EU compliance

ESOS Phase 4 requires qualifying UK organisations to assess energy used by buildings, industrial processes and transport. The assessment must identify significant energy consumption representing at least 95% of total consumption. Energy-intensity ratios are required for buildings, transport, industrial processes and other energy uses.
For industrial sites, a process-level energy balance supplies a defensible basis for that work. It turns an intensity ratio into an explanation of the underlying drivers: throughput, moisture removed, product mix, operating hours, ambient conditions, process temperature and recoverable heat.
An ESOS-compliant energy audit must use verifiable consumption data as far as reasonably practicable, analyse energy consumption and efficiency, identify opportunities and include site visits. The process balance should therefore retain the operating data, calculations, assumptions, meter checks and site observations behind each recommendation.
ISO 50001:2018 remains current, having been reviewed and confirmed in 2024. Its energy-management framework supports the ongoing discipline that a one-off audit cannot provide. Energy Performance Indicators and Energy Baselines allow a site to compare equivalent operating conditions over time. ISO 50006:2023 provides guidance on establishing, using and maintaining those indicators and baselines.
For EU-facing sites, Article 11 of Directive (EU) 2023/1791 raises the importance of this evidence. Enterprises averaging more than 85 TJ per year over the previous three years must implement an energy-management system by 11 October 2027. Enterprises above 10 TJ per year that do not implement such a system require an energy audit by 11 October 2026, then at least every four years. Commission Recommendation (EU) 2024/2002 identifies EN ISO 50001 and EN 16247-1 as relevant standards.
A well-maintained balance model gives the site a technical record between reporting cycles. It also provides a faster route from an unexplained utility variance to an operational test, a verified measure and a durable baseline.
From hidden losses to verified improvement
Energy balance analysis earns its place when the model changes a plant decision. That may mean repairing a steam leak, changing a control target, cleaning a heat exchanger, recovering flash steam, revising batch sequencing or rejecting a heat-recovery project that lacks a viable sink.
The essential discipline is validation. Before implementation, document the baseline, relevant variables and expected change. After implementation, repeat measurements under comparable operating conditions. Production mix, weather, throughput and campaign timing can otherwise turn normal variation into a claimed saving.
This approach converts energy from a cost line into a measurable process variable. It shows where heat creates product value, where it constrains output and where it leaves the plant without doing either.
This article reflects the independent analysis and editorial opinion of EnerTherm Engineering. Product names, trademarks, and brands mentioned belong to their respective owners. EnerTherm Engineering is not affiliated with, endorsed by, or a licensee of any third-party software or product mentioned unless explicitly stated.

Simulation Engineer — EnerTherm Engineering
Rajesh Sekar is a Simulation Engineer at EnerTherm Engineering, specialising in computational fluid dynamics (CFD), finite element analysis (FEA), and thermal process simulation. He holds a degree from Cranfield University and brings extensive experience in simulation-based product development from the automotive, aerospace, and energy sectors.
