Industrial Process Troubleshooting: 11 Steps to Find Losses
How heat and mass balances expose throughput, energy and quality losses.
Industrial process troubleshooting engineering uses plant data, field observation, heat and mass balances, and operating knowledge to identify the physical cause of lost throughput, excess energy use, unstable operation, quality deviation or equipment constraint.
A dryer that suddenly needs more steam, a reactor campaign with lower yield or a distillation column that will not hold specification can appear to be separate problems. Often they share a simpler cause: the process no longer behaves as its design basis assumes. A feed has changed, an instrument has drifted, a heat-transfer surface has fouled, an operating practice has become normalised or a change has altered a constraint elsewhere in the process.
The strongest troubleshooting programmes do not begin with a preferred answer. They establish the loss, test the available evidence, close a balance, inspect the plant and then rank corrective actions. This 11-step method gives UK process engineers, production managers and reliability leaders a practical route from a recurring deviation to a defensible engineering decision.
Why industrial process troubleshooting engineering starts with a balance
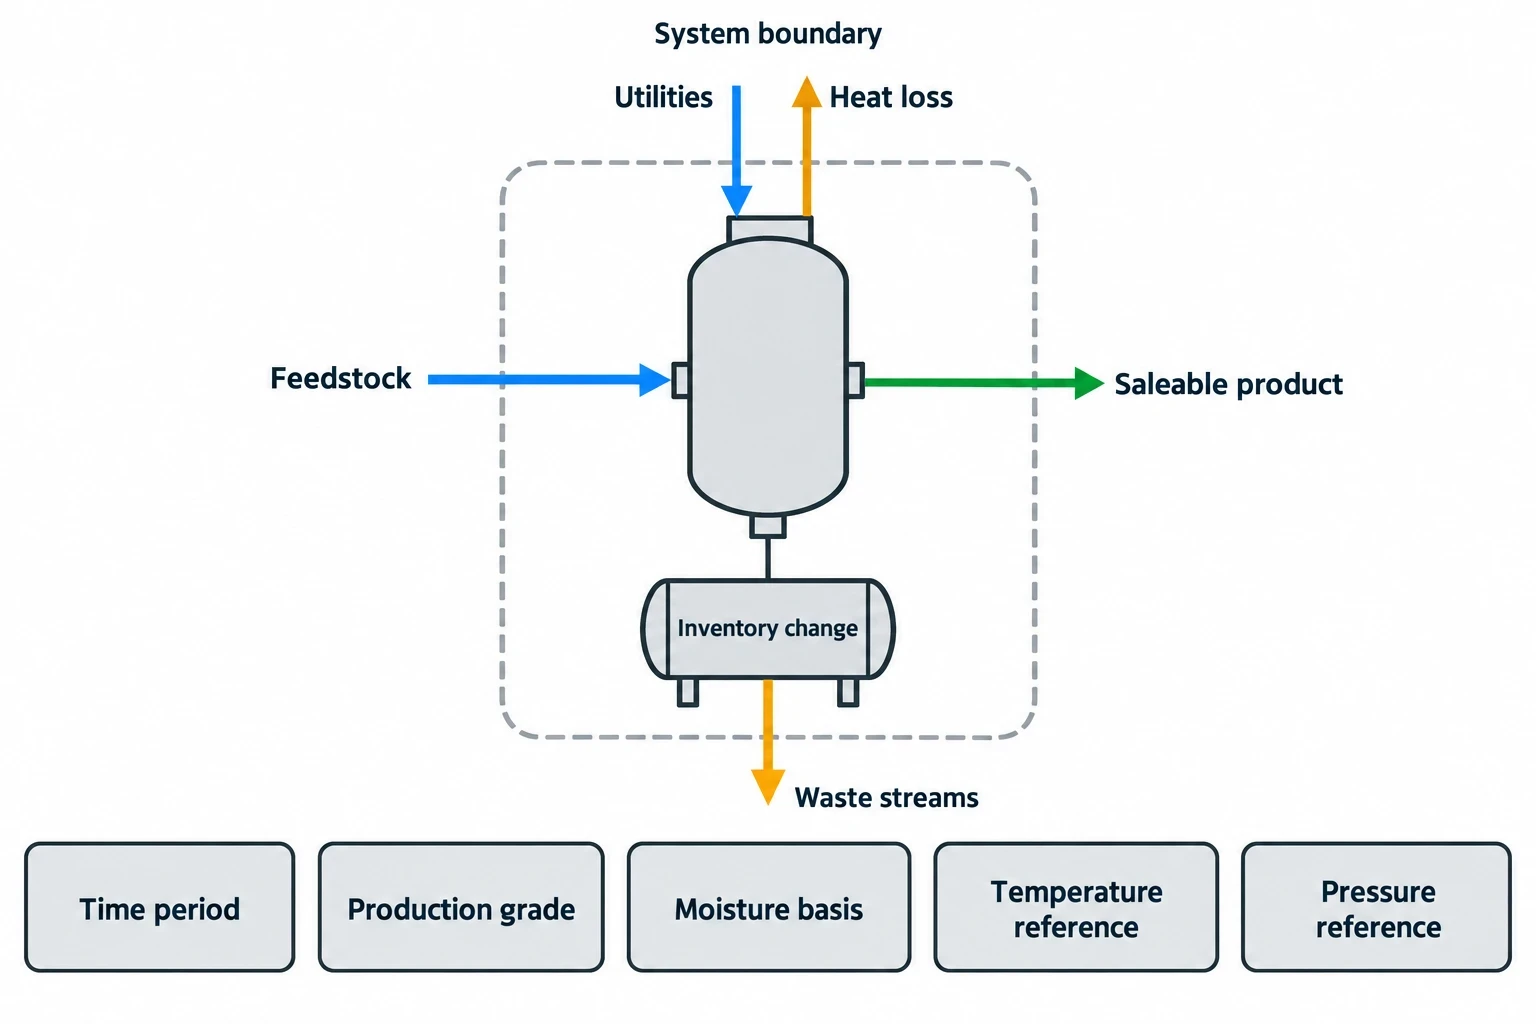
A process balance establishes whether the reported loss is real, where it occurs and how large it is. Without that baseline, teams can spend weeks tuning controls around a bad measurement or cleaning equipment that does not limit production.
Losses occur in mass, energy, time and quality
A throughput problem may present as fewer tonnes of saleable product, but its cause can be a mass loss, heat loss, utility limitation, operational delay or quality constraint.
Common examples include:
- Product retained in vessels, filters, pipework or packaging systems
- Higher moisture leaving a dryer, reducing capacity or increasing rework
- Steam loss through failed traps, leaks, poor condensate recovery or excess venting
- Fouling in a heat exchanger, evaporator, dryer, kettle or reboiler
- Excess recycle, off-spec production, purge, flare or effluent load
- A pump, compressor, fan, valve or heat exchanger restricting flow
- Production interruptions caused by cleaning, grade changes, trips or unstable control
The diagnostic task is to distinguish the visible symptom from the controlling mechanism. A falling production rate may result from an upstream raw-material condition, downstream pressure constraint, utility shortfall or operator response to an unstable variable.
The balance must fit the operating period
A single historian snapshot rarely represents a batch, campaign or continuous process properly. Select a period that reflects the loss and separate it from start-up, shutdown, cleaning, grade-change and known upset conditions.
For a continuous process, use a stable operating window long enough to average normal control movement. For batch manufacture, define the batch boundary and include all additions, transfers, sampling, recovery and waste streams. In food, pharmaceutical and speciality chemical operations, yield calculations must also reflect material held in filters, transfer lines, intermediate bulk containers and cleaning losses.
A credible heat and mass balance states the basis clearly: time period, production grade, feedstock, moisture basis, temperature and pressure references, and treatment of inventory change.

Map every energy and material flow in your process with detailed heat and mass balance calculations — the foundation for any optimisation or design project.
Step 1 to Step 3: Define the loss before collecting more data
Step 1: Write a precise problem statement
State what has changed, when it began and which business or operating measure it affects. “The line is inefficient” is not a troubleshooting statement. “Saleable output from Line 3 fell from the established campaign range after the March maintenance shutdown, while specific steam consumption increased” gives the investigation a testable boundary.
Set one primary loss measure and a small number of supporting measures. Examples include:
- Saleable tonnes per operating hour
- Batch yield as a percentage of charged raw material
- Steam use per tonne of evaporated water
- Electrical energy per tonne of product
- Off-spec rate
- Cycle time
- Unplanned downtime associated with a named asset or process area
Record effects on safety, quality and environmental performance from the outset. Production recovery that increases pressure, temperature, flammable inventory, emissions or contamination exposure is not an acceptable remedy.
Step 2: Freeze the reference case
Find the last period when the plant achieved the desired outcome under comparable conditions. That becomes the reference case, rather than a nameplate capacity quoted from a design document.
Compare the reference and current cases using the same units and boundary. Include feed rate and composition, product specification, temperatures, pressures, flows, utility loads, recycle rates, operating hours, downtime and relevant laboratory results.
A reference case also exposes false comparisons. A plant can appear less efficient because it now produces a different grade, handles wetter feed, operates at lower loading or has more frequent clean-in-place cycles. Those differences belong in the balance.
Step 3: Form an evidence plan
Collect only the information needed to test plausible causes. Start with the current PFD, P&IDs, equipment data sheets, operating procedures, alarm and trip histories, laboratory records, maintenance work orders and production logs.
Historian tags need context. Confirm a tag’s engineering units, range, calibration status, location and control purpose. A flow measurement taken upstream of a recycle line cannot prove final production flow. A tank-level trend may indicate accumulation, but only when level-to-volume geometry is known.
Field checks often identify what historian screens conceal: a bypass left open, a blocked impulse line, a valve that does not reach position, a steam trap discharging continuously, a vibrating pump, a hot pipe downstream of insulation damage or a temporary hose connection that became permanent.
Step 4 to Step 6: Close the heat and mass balance
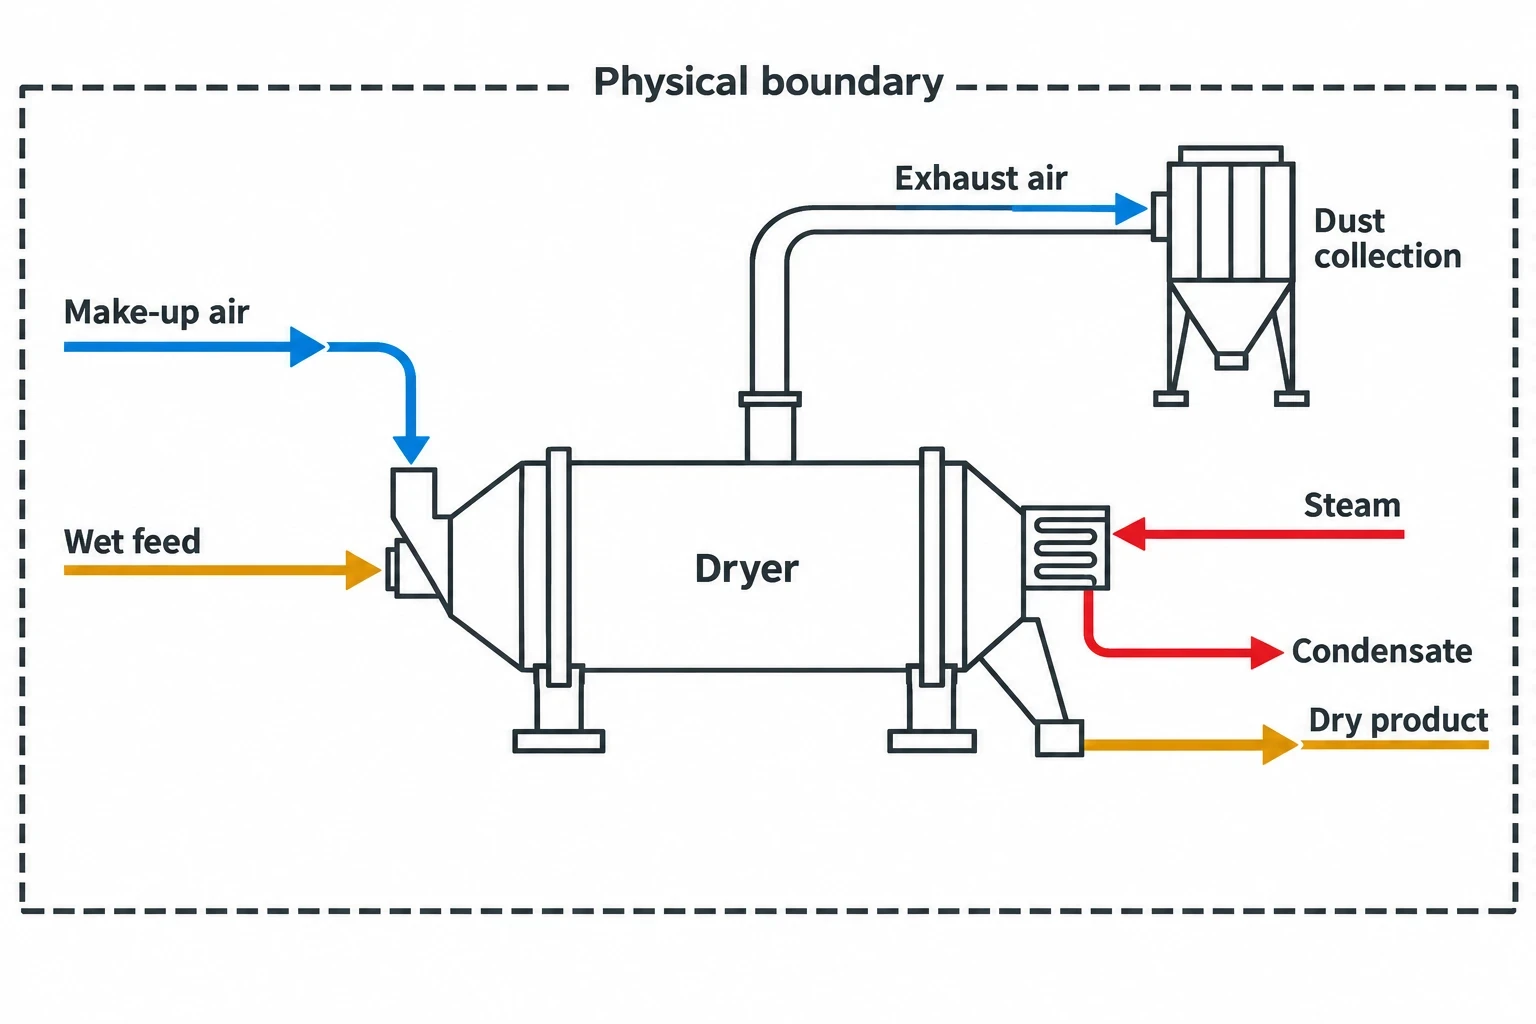
Step 4: Draw the process boundary and stream list
Define the physical boundary around the problem. For a dryer, that may include wet feed, dry product, exhaust air, make-up air, steam, condensate, cooling water and dust collection. For a distillation system, it may include feed, overhead, bottoms, reflux, reboiler steam, condenser duty, vent and reflux-drum inventory.
Create a stream list before calculating anything. Give each stream a tag, location, phase, expected measurement source and degree of confidence. This prevents unmeasured routes from disappearing from the analysis.
In a mass balance, include feed, product, recycle, waste, emissions, samples, drains, purge and inventory change. Species balances matter where composition drives yield, reaction, separation or emissions. Total mass can appear to close while a component imbalance reveals solvent loss, incorrect assay or unaccounted dilution.
Step 5: Test measurement quality
Troubleshooting teams should not treat every tag as equally reliable. Rank each measurement by traceability and expected error. Weighbridge records and calibrated utility meters may be strong evidence. Inferred flows, estimates from valve position and manually entered values require corroboration.
Check for:
- Zero drift, span errors and sensor fouling
- Incorrect density, temperature or pressure compensation
- Flowmeter installation effects, including partially full pipes or inadequate straight runs
- Mismatched time stamps and historian sampling intervals
- Laboratory sampling location, method and delay
- Totalisers that reset, use the wrong multiplier or capture a different boundary
- Instrument ranges too wide for the normal operating region
Reconcile measurements after checking them against plant reality. Reconciliation can identify a probable measurement error, but it must not overwrite evidence of a real leak, accumulation or unmeasured discharge.
Step 6: Quantify the energy loss and equipment duty
Use the balance to compare current and reference duties. In thermal processes, account for sensible heating, phase change, reaction heat where applicable, heat recovery, stack or exhaust loss, cooling duty and heat loss to surroundings.
For a dryer, assess kilograms of water removed, inlet and outlet moisture, exhaust condition, air flow, steam pressure, condensate temperature and fan load. For an evaporator, compare evaporation rate, steam use, condensate recovery, vapour recompression performance, fouling indicators and vacuum condition. For a heat exchanger, compare approach temperatures, pressure drop, flow distribution and duty against the clean or reference condition.
The calculation should identify an energy gap in physical terms. “Steam use is high” becomes “the process needs more steam per tonne of water removed, while condensate temperature and heat-exchanger pressure drop indicate a heat-transfer or condensate-removal issue.” That statement directs inspection and testing.
Step 7 to Step 9: Locate the operating constraint
Step 7: Establish the real bottleneck
The bottleneck is the point that prevents the plant from making more saleable product safely and within specification. It changes with feedstock, grade, ambient conditions, equipment condition and operating mode.
Observe the process at the rate limit. Look for high levels upstream of a restriction, starving equipment downstream, control valves at their limit, rising pressure drop, maximum fan or pump speed, recurring alarms, long batch holds or quality limits reached before mechanical capacity.
A visible queue is evidence, not proof. A full surge tank may result from a downstream restriction, but it may also reflect a control strategy, planned sequencing or an upstream rate disturbance. Trace cause and effect across the process boundary.
Step 8: Separate causes by mechanism
Use the balance and field evidence to group candidate causes into mechanisms:
| Mechanism | Typical evidence | Useful confirmation |
|---|---|---|
| Heat-transfer loss | Rising temperature approach, increased steam demand, higher pressure drop | Inspection, cleaning trial, temperature and pressure verification |
| Flow restriction | Reduced flow at high valve position, rising differential pressure | Valve stroke test, pump curve check, line inspection |
| Measurement error | Imbalance centred on one uncertain stream | Calibration check, independent measurement |
| Feedstock variation | Changed moisture, composition, particle size or assay | Retained samples, supplier data, laboratory analysis |
| Control instability | Cycling manipulated variable, repeated alarm response | Trend review, loop test, control narrative review |
| Operating-practice change | Different sequencing, set point, cleaning duration or bypass use | Shift interviews, procedure and log review |
| Material loss | Unexplained inventory reduction, abnormal waste or effluent | Walkdown, tank reconciliation, drain and vent review |
A cause earns priority when it explains the timing, magnitude and direction of the deviation. A fouled heat exchanger, for example, should account for the observed duty shortfall, temperature pattern and pressure-drop change. If it does not, keep testing.
Step 9: Check operating discipline, maintenance and change history
Recurring losses often follow a maintenance outage, software change, new supplier, revised recipe, altered cleaning regime or temporary workaround. Review what changed before the deviation began, including changes considered minor.
HSE guidance on plant modification and change procedures states that modifications involving procedures, equipment, people or substances should be subject to formal management procedures. This matters in routine production as much as in major projects. A revised operating instruction can alter residence time, reflux, drying temperature, pump operation or cleaning effectiveness.
For COMAH establishments, the Control of Major Accident Hazards Regulations 2015 require a written Major Accident Prevention Policy under Regulation 7 and implementation through a safety management system. HSE identifies hazard evaluation, operational control, management of change, emergency planning, monitoring, audit and review as central areas. A throughput investigation must therefore protect the operating envelope and feed any relevant change-control process.
Map every energy and material flow in your process with detailed heat and mass balance calculations — the foundation for any optimisation or design project.
Step 10 and Step 11: Prove the remedy and hold the gain
Step 10: Rank actions by evidence, risk and value
Develop corrective actions only after the team has established the dominant loss mechanism. Rank each action against expected gain, implementation effort, safety and quality risk, outage requirement, confidence in the evidence and ability to verify the result.
The first action may be a low-risk repair, calibration, cleaning task, restored insulation section, corrected set point or removal of an unauthorised bypass. Larger options may include heat-exchanger area, pump, fan, separation equipment, heat recovery or control-system changes.
Treat trials as controlled engineering tests. Define the hypothesis, operating limits, required approvals, measurements, acceptance criteria and abort conditions. HSE guidance advises that process and plant modifications should receive a traceable safety, engineering and technical review. This protects people and prevents a local performance improvement from creating another constraint.
Step 11: Verify performance and create the single source of truth
Verify the action using the same boundary and basis as the original reference comparison. Track enough operating time to establish that the improvement survives normal variation in feed, weather, shift pattern and production schedule.
The final deliverable should be a controlled PFD with embedded stream data, a validated mass and energy balance, key assumptions, instrument-confidence notes, the identified constraint, actions taken and measured results. A Sankey energy map can support this record where multiple utilities or major loss routes need clear communication.
The document gives operations, maintenance, energy and capital-project teams one agreed description of plant performance. It also prevents the site from reopening the same investigation with different data and different boundaries six months later.
How process safety and ESOS Phase 4 strengthen troubleshooting
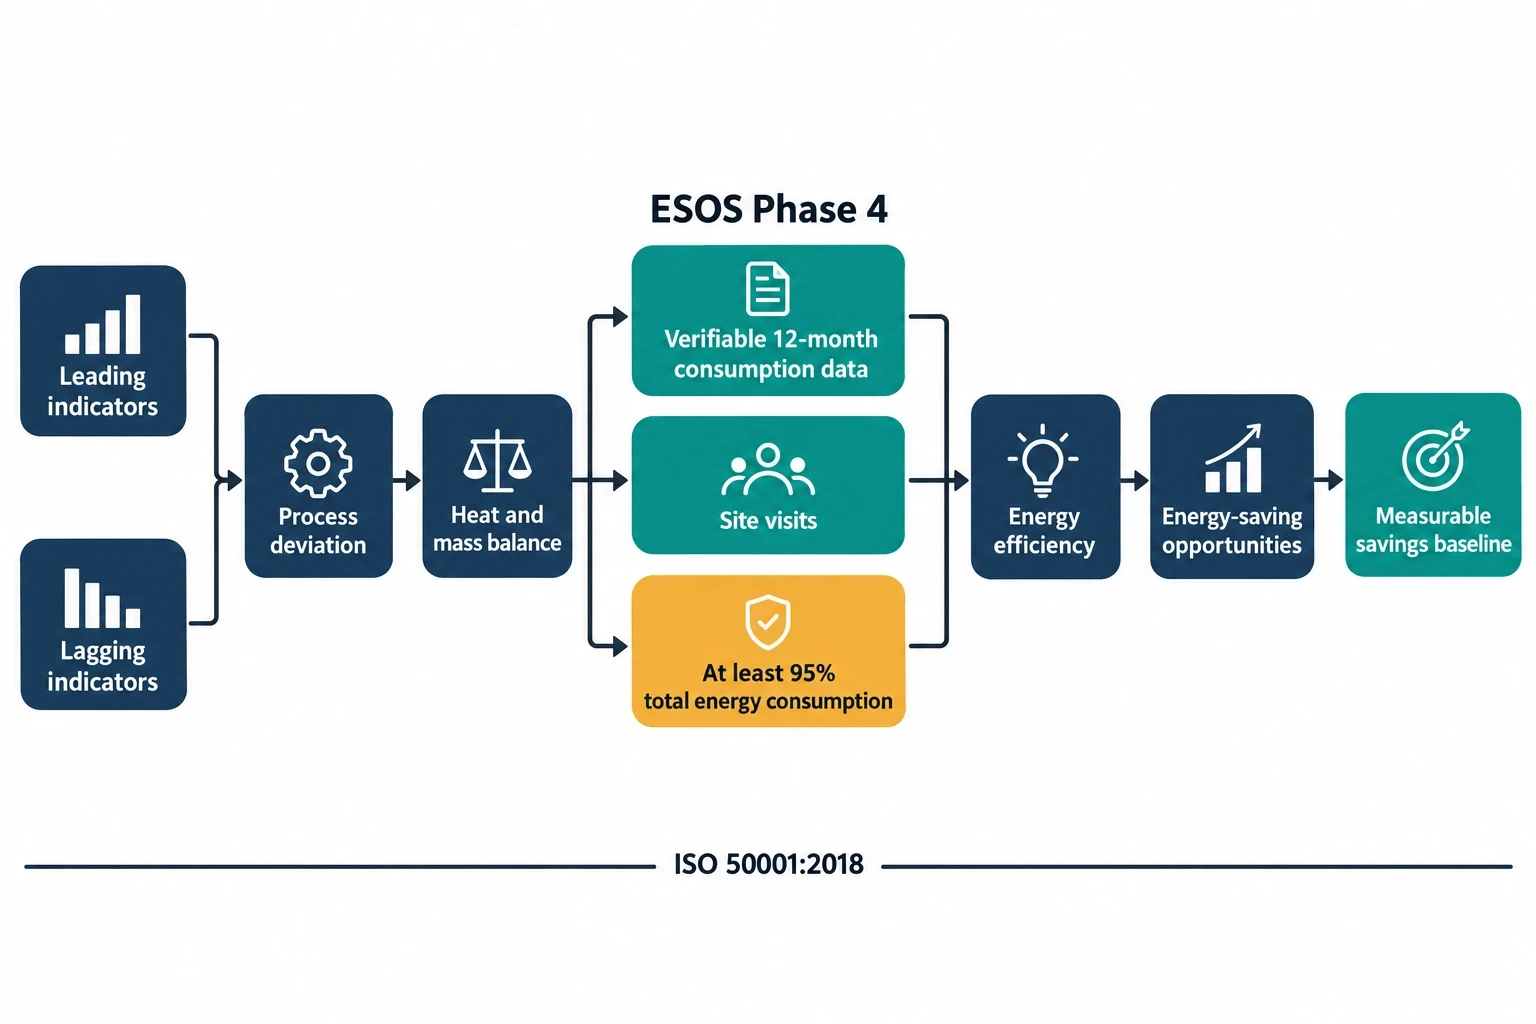
HSE’s HSG254 distinguishes active leading indicators from reactive lagging indicators. Applied to troubleshooting, a lagging measure might be off-spec batches, repeated high-temperature alarms, heat-exchanger fouling frequency or unplanned trip hours. Leading measures can examine whether critical actions occur as intended, such as calibration completion, planned steam-trap surveys, valve stroke testing, alarm-response training or timely closure of management-of-change actions.
This pairing separates a recurring process deviation from the management-system weakness that permits it to recur. It also avoids using production output alone as a proxy for safe, controlled operation.
Energy investigations now have an additional planning value. Under ESOS Phase 4, significant energy consumption must account for at least 95% of total energy consumption, and the notification of compliance deadline is 5 December 2027. Eligible audit evidence must, so far as reasonably practicable, use verifiable 12-month consumption data, include site visits, analyse energy consumption and efficiency, and identify energy-saving opportunities.
A well-constructed heat and mass balance can provide a strong engineering basis for that work. It links site energy data to the process that consumes it, identifies the physical cause of avoidable use and provides a measurable baseline for savings. ISO 50001:2018 provides a management-system framework for improving energy performance, including energy efficiency, use and consumption.
Industrial process troubleshooting engineering turns data into a decision
The 11 steps impose a useful order on difficult investigations: define the loss, establish a fair reference, confirm the data, close the balances, find the constraint, test the mechanism, control change and verify the result.
That order is especially valuable where plant teams face competing explanations from operations, maintenance, quality and engineering. A shared, validated balance brings those views back to measurable flows, duties, inventories and operating limits.
This article reflects the independent analysis and editorial opinion of EnerTherm Engineering. Product names, trademarks, and brands mentioned belong to their respective owners. EnerTherm Engineering is not affiliated with, endorsed by, or a licensee of any third-party software or product mentioned unless explicitly stated.

Managing Director — EnerTherm Engineering
Dr. François Pierrel is Managing Director of EnerTherm Engineering with over two decades of expertise in thermal design, heat transfer, and industrial energy optimisation. He holds a PhD in Heat Transfer from Cranfield University and a Post-Doctorate from Heriot-Watt University.
