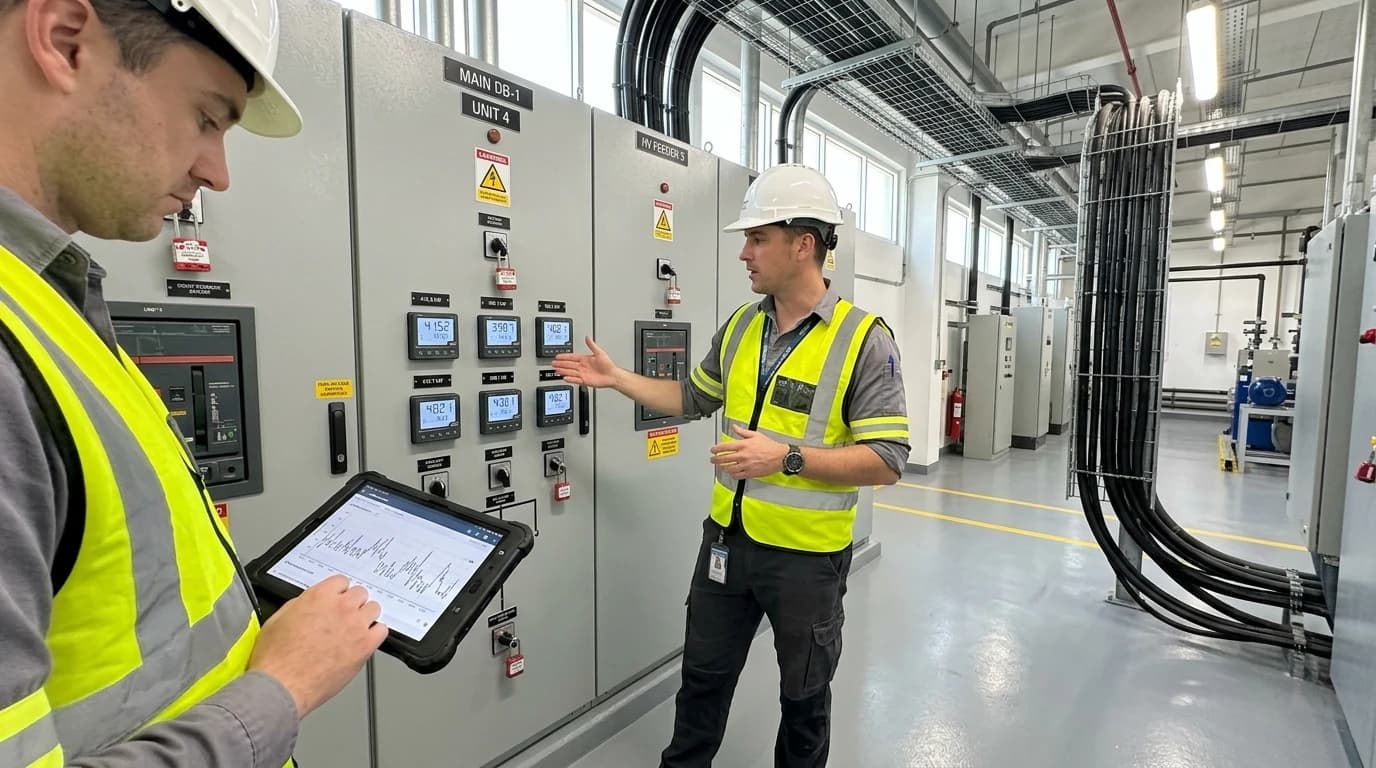
Predictive Energy Analytics for Industry Cuts Peak Tariffs
Meeting ISO 50001 Clause 9.1 and UK Energy Act 2023 targets to cut costs by 15-25%.

Omni Vision delivers turnkey utility metering, CO2 tracking, and AI-powered production KPI intelligence — giving you real-time dashboards and actionable insights across your entire facility.
Defining Predictive Energy Analytics for Industry

Predictive energy analytics for industry is a data-driven method that combines machine learning algorithms, real-time utility metering, and production schedules to forecast future power demand and identify load-shifting opportunities before high-tariff windows occur. This advanced methodology replaces retrospective energy monitoring with forward-looking intelligence. It processes high-frequency time-series data from critical production equipment, building-management systems, and plant-wide utility networks to predict electrical and thermal demand up to 48 hours in advance.
What Is Predictive Energy Analytics for Industry?
At its base, predictive analytics relies on mathematical regression models and neural networks that ingest multiple real-time inputs. These inputs include environmental conditions, such as ambient dry-bulb temperature, relative humidity, and atmospheric pressure. They also include operational parameters, such as manufacturing batch sizes, product recipes, raw material characteristics, and shift schedules. By correlating historical energy consumption patterns with these operational variables, the analytical engine models the thermal and electrical demand curves of the facility.
For instance, in a pharmaceutical manufacturing facility, the energy consumption of a cleanroom heating, ventilation, and air conditioning (HVAC) system is heavily dependent on ambient humidity and outdoor temperature. The predictive engine analyses these meteorological forecasts alongside the production schedule to calculate the expected HVAC thermal load for the coming day. Plant engineers use this information to pre-cool or pre-heat thermal storage systems, avoiding grid draw during high-cost windows.
Transitioning from Reactive Reporting to Proactive Management
Traditional industrial energy management operates on a retrospective basis. Energy managers typically receive utility invoices 30 to 45 days after the energy has been consumed. Some plants attempt to supplement this with manual spreadsheet tracking, where technicians log meter readings on a daily or weekly basis.
This legacy approach suffers from several severe limitations:
- Manual data entry introduces transcription errors, resulting in corrupted datasets that compromise decision-making.
- The significant lag between consumption and reporting means that costly operational inefficiencies, such as a malfunctioning air compressor or a degraded steam trap, can persist for weeks before discovery.
- Retrospective data cannot prevent instantaneous demand spikes that breach agreed capacity thresholds, which immediately incurs punitive penalties from the utility provider.
Predictive energy analytics replaces this reactive model with real-time, automated monitoring. The platform continuously compares live meter readings against the predictive baseline model. When consumption deviates from the expected profile, the platform flags the anomaly immediately. This allows maintenance teams to intervene before the excess consumption manifests on the monthly utility bill.
The 2026 UK Tariff Shift: Managing TCR, TNUoS, and DUoS
The economic pressure on UK manufacturers has intensified due to structural reforms in grid pricing structures. Understanding how electricity transmission and distribution costs are billed is essential for maintaining operational profitability.
The Impact of the April 2026 Network Charge Rises
Under Ofgem’s Targeted Charging Review (TCR) framework, the National Energy System Operator (NESO) implemented a steep increase in Transmission Network Use of System (TNUoS) charges on 1 April 2026. This resulted in a volume-weighted average TNUoS residual charge increase of approximately 64 per cent across Great Britain, with some specific commercial bands experiencing increases of over 100 per cent. These network costs are recovered primarily through fixed daily standing charges based on a site's voltage connection level and its agreed supply capacity (measured in kVA), rather than purely volumetric consumption tariffs.
This pricing structure penalises factories that maintain excessive agreed supply capacity bands. If an industrial facility contracts for an agreed capacity of 400 kVA but its peak demand historically remains below 100 kVA, the site faces substantial, unmitigated fixed standing charges. The table below outlines the daily and annual impact of the April 2026 TNUoS residual charge rises across various commercial bands:
| Connection Band and Meter Type | 2025/26 TNUoS Tariff (£/day) | 2026/27 TNUoS Tariff (£/day) | Approximate Annual Increase (£/year) |
|---|---|---|---|
| Small Business (NHH Medium Band) | 0.76 | 1.60 | 306 |
| Half-Hourly Metered LV1 (0 to 80 kVA) | 3.91 | 7.28 | 1,230 |
| Half-Hourly Metered LV2 (80 to 150 kVA) | 6.53 | 14.41 | 2,876 |
To mitigate these rising fixed costs, plant engineers must use predictive energy profiles to precisely identify their actual peak demand requirements. This enables them to safely lower their contracted kVA capacity with the Distribution Network Operator (DNO) without risking automatic trips or over-capacity penalties.
Mitigating DUoS Red-Amber-Green (RAG) Peak Tariffs
While TNUoS charges have transitioned largely to fixed daily fees, Distribution Use of System (DUoS) tariffs continue to utilise a time-of-use Red-Amber-Green (RAG) pricing structure. The Red band represents the daily period of peak grid demand, typically occurring between 16:00 and 19:00 or 20:00 on weekdays depending on the specific DNO region. Unit rates during this Red window are extremely high, often four to five times more expensive than Green night-time rates.
Manufacturers with flexible electrical and thermal loads can mitigate these punitive charges by utilising predictive load-shifting algorithms. This involves identifying load-shifting opportunities so that operators or existing building-management systems (BMS) can pause or schedule processes around the Red band. For example, in a food processing plant, operators can use the platform's forecasts to run industrial refrigeration systems and chilled-water loops at maximum capacity during Green or Amber hours, over-cooling storage spaces. During the Red peak window, operators or local automation systems scale down the cooling compressors based on these predictive recommendations, allowing the thermal mass of the cold rooms to maintain temperature parameters without drawing expensive grid power.

Track energy consumption, emissions, and process parameters with seamless PLC/SCADA integration via Modbus, OPC-UA, and MQTT protocols.
Moving Beyond Legacy Triad Avoidance

The transition in UK grid regulation has altered the way industrial facilities manage network charges, requiring operators to adopt modern demand-side strategies.
The Transition to Fixed Capacity Bands
For decades, high-energy industrial users focused their peak-management efforts on Triad avoidance. Triads were the three half-hour periods of highest demand on the Great Britain electricity transmission system between November and February, separated by at least ten clear days. Heavy users who successfully reduced their consumption during these three half-hours could save tens of thousands of pounds in annual TNUoS charges.
However, the TCR reforms have phased out volumetric Triad-based charging for demand users, replacing it with the fixed daily standing charge bands. This represents a structural shift in how industrial sites must manage network charges. Rather than relying on occasional, manual Triad warnings to shut down production for a few hours, manufacturers must now focus on continuous, daily capacity management. This requires permanent optimisation of the site's base load and precise tracking of peak demand profiles to minimise contracted kVA bands.
Quantifying Peak Shaving versus Load Shifting
Managing peak tariffs requires a clear technical distinction between peak shaving and load shifting. Although both methods reduce utility costs, they rely on different mechanisms and operational profiles:
- Peak Shaving: This strategy aims to flatten short, intense spikes in electricity demand. By utilising the platform's real-time forecasting, plant operators or local control systems can identify when energy consumption is likely to approach a critical pre-set threshold (such as a limit that would breach the contracted kVA band) and temporarily shed non-essential loads during validated change windows. This may involve delaying an electric oven start-up, pausing a backup water pump, or drawing power from an on-site battery storage system. Peak shaving reduces the maximum instantaneous power draw but does not change the total volume of energy consumed.
- Load Shifting: This strategy moves large blocks of energy consumption from high-tariff periods, such as DUoS Red bands, to cheaper off-peak windows, such as Green bands. Based on the platform's predictive insights, operators can schedule production runs or thermal pre-treatment to act as an energy buffer, shifting consumption without altering the total volume of energy consumed over 24 hours. This strategy is highly effective for continuous-batch industries, such as chemical formulation or beverage brewing.
By integrating predictive analytics, plant managers can model both strategies simultaneously. The platform forecasts the exact timing and magnitude of upcoming process loads, allowing operators to plan production around DUoS Red bands while ensuring that the instantaneous load does not breach the contracted kVA ceiling.
Achieving ISO 50001:2018 and Energy Act 2023 Compliance

As regulatory scrutiny on industrial carbon emissions and energy efficiency intensifies, digital compliance tracking has transitioned from an administrative preference to an operational necessity.
Automating ISO 50001:2018 Clause 9.1 Compliance
The international standard ISO 50001:2018 defines the requirements for establishing, implementing, maintaining, and improving an energy management system. Within this standard, Clause 9.1 (Monitoring, measurement, analysis and evaluation) requires organisations to monitor their key energy characteristics. This includes evaluating actual energy performance against established energy performance indicators (EnPIs) and energy baselines (EnBs), and investigating any significant deviations.
Manual spreadsheet tracking is inadequate for satisfying Clause 9.1. Spreadsheets fail to capture high-frequency anomalies, such as a localised vacuum pump leak or a cooling tower fan operating with a misaligned belt. These inefficiencies can persist for months, inflating energy bills and invalidating baseline models.
Predictive energy analytics platforms automate and simplify ISO 50001:2018 Clause 9.1 compliance. The cloud-based AI engine continuously monitors real-time data from across the facility and applies predictive regression models to establish a dynamic, production-linked energy baseline. If a system’s energy consumption deviates from this predictive baseline, for instance, if a refrigeration compressor's coefficient of performance drops due to a refrigerant leak, the platform automatically flags the anomaly. This automated detection provides maintenance teams with immediate, actionable alerts and generates unmodifiable, audit-ready compliance records that simplify external ISO 50001 certification audits.
The Energy Act 2023 and Net-Zero Reporting
The UK Energy Act 2023 establishes a comprehensive legal framework designed to accelerate low-carbon investments, enhance energy security, and enforce stringent net-zero targets. A primary impact of the Act is the expansion of mandatory energy efficiency and carbon performance reporting across the industrial sector. Under these strengthened rules, manufacturers must transition from estimated carbon profiles to precise, auditable disclosures.
Predictive energy analytics platforms turn this mandatory reporting requirement into an active driver of operational cost reduction. By tracking and forecasting both energy consumption and real-time grid carbon intensity, the platform allows manufacturers to align energy-intensive operations with periods when the grid is supplied primarily by low-carbon, renewable sources. This reduces both Scope 2 emissions and unit energy costs, as high-renewable periods often coincide with lower wholesale electricity prices.
Automated Auditing for Multi-Regulation Environments
Industrial manufacturing sites are subject to multiple, overlapping environmental and energy frameworks. Manually compiling the necessary data for these various reports is labour-intensive and prone to reporting errors. Modern predictive platforms integrate this data collection into a single environment, generating audit-ready reports for:
- Streamlined Energy and Carbon Reporting (SECR)
- Energy Savings Opportunity Scheme (ESOS) Phase 4
- UK Emissions Trading Scheme (UK ETS)
- Greenhouse Gas (GHG) Protocol Corporate Standard (Scope 1 and Scope 2 emissions)
- Task Force on Climate-Related Financial Disclosures (TCFD)
- Carbon Disclosure Project (CDP)
By logging raw, unmodifiable data streams directly from physical meters, the platform provides third-party auditors with a transparent, verifiable chain of custody for all energy and emissions data.
Non-Invasive Architecture: The Omni Vision Technical Blueprint
Implementing advanced analytics within complex manufacturing facilities requires a highly secure hardware and software architecture that does not compromise process safety or product quality.
One-Way Encrypted Data Flow for Plant Integrity
Industrial plants within the pharmaceutical, chemical, and food and beverage sectors operate under strict regulatory and safety frameworks, including Good Manufacturing Practice (GMP) and Hazard Analysis and Critical Control Points (HACCP). In these sensitive environments, any digital system that writes data back to plant programmable logic controllers (PLCs) or modifies SCADA settings poses an unacceptable safety risk that could compromise batch quality or safety validation.
To maintain absolute plant safety, the Omni Vision Energy Intelligence Platform utilises a non-invasive, read-only physical deployment model. The local edge hardware connects to plant PLCs and existing meters on a read-only basis, extracting data without the ability to write back or modify any control loops. The platform supports a wide range of industrial communication protocols:
- Modbus (TCP/RTU): For connecting to electrical meters, flow meters, and variable speed drives.
- OPC-UA: For secure, high-speed data exchange with modern SCADA and PLC networks.
- BACnet (IP/MSTP): For integrating with building-management systems and HVAC plant.
- MQTT: For lightweight, low-latency transmission of sensor data to the cloud.
All extracted data is pushed to EPSA Cloud Intelligence via a secure, one-way encrypted outbound connection. This outbound-only architecture prevents any external write access, maintaining zero-write boundaries and preserving the validated state of manufacturing assets.
Granular Metering of Six Core Utility Streams
True predictive intelligence requires visibility beyond the primary electricity meter. The platform provides continuous, real-time monitoring of six core utility streams:
- Electricity: Active, reactive, and apparent power, along with power factor and harmonic distortion.
- Gas: Volumetric and mass flow of natural gas used in boilers, CHP units, and direct-fired ovens.
- Water: Consumption rates, temperatures, and recovery volumes for process water and cleaning systems.
- Steam: Mass flow, pressure, and dryness fraction to monitor boiler efficiency and steam trap integrity.
- Compressed Air: Volumetric flow, system pressure, and dew point to detect leakages and artificial demand.
- Oil: Mass flow and thermal energy delivery of fuel oils used in auxiliary heating and backup generation.
By correlating these six utility streams with production outputs, such as PLC-logged batch numbers or conveyor speeds, the platform calculates precise production-linked key performance indicators (KPIs), such as energy consumed per batch of pharmaceutical product, or cost per tonne of chemical output. These production-linked KPIs expose specific areas of waste, such as a vacuum system running continuously during a production pause, or a boiler system experiencing excessive blowdown losses.
EPSA Cloud Intelligence and Turnkey Deployment
The intelligence of the platform is powered by EPSA Cloud Intelligence. The combination of local read-only hardware integration and cloud-based AI analytics allows for a rapid, turnkey deployment model that typically takes between 8 and 16 weeks from initial site survey to full operational status.
This rapid setup avoids the years of custom software development and consulting overhead associated with traditional enterprise energy-management systems. By immediately identifying utility anomalies and enabling operators to shift thermal and electrical loads away from peak pricing windows, industrial facilities regularly achieve energy cost reductions of 15 to 25 per cent. This rapid yield translates to a sub-12-month return on investment (ROI). This performance is backed by a 12-year track record with over 150 successful industrial installations, proving that data-driven demand flexibility is a highly reliable method for mitigating volatile network tariffs.
This article reflects the independent analysis and editorial opinion of EnerTherm Engineering. Product names, trademarks, and brands mentioned belong to their respective owners. EnerTherm Engineering is not affiliated with, endorsed by, or a licensee of any third-party software or product mentioned unless explicitly stated.

Managing Director — EnerTherm Engineering
Dr. François Pierrel is Managing Director of EnerTherm Engineering with over two decades of expertise in thermal design, heat transfer, and industrial energy optimisation. He holds a PhD in Heat Transfer from Cranfield University and a Post-Doctorate from Heriot-Watt University.
