
Refinery Utility System Optimisation: Steam Mapping
A refinery audit uses BAT measures to trace steam, fuel-gas and power losses.
Steam mapping is the systematic measurement and reconciliation of steam generation, distribution, use, condensate return and loss across a refinery utility system. The EU Refining BREF estimates that boilers account for 10% to 20% of refinery energy demand, making steam-system performance a material part of refinery utility system optimisation.
A refinery steam system is a linked energy network. Fired boilers, waste-heat boilers, turbines, pressure-reducing stations, process users, condensate systems and flare connections affect the balance. A local intervention can transfer cost or operational risk elsewhere if engineers lack a verified view of the whole network.
A steam map is more than a marked-up P&ID. It is a time-bound mass and energy balance that identifies where steam enters the system, where useful heat is delivered, where condensate returns, and where energy leaves through vents, leaks, drains, cooling, blowdown or flaring. It turns the utility system from a collection of headers into an operational model.
Why steam mapping matters in refinery utility system optimisation
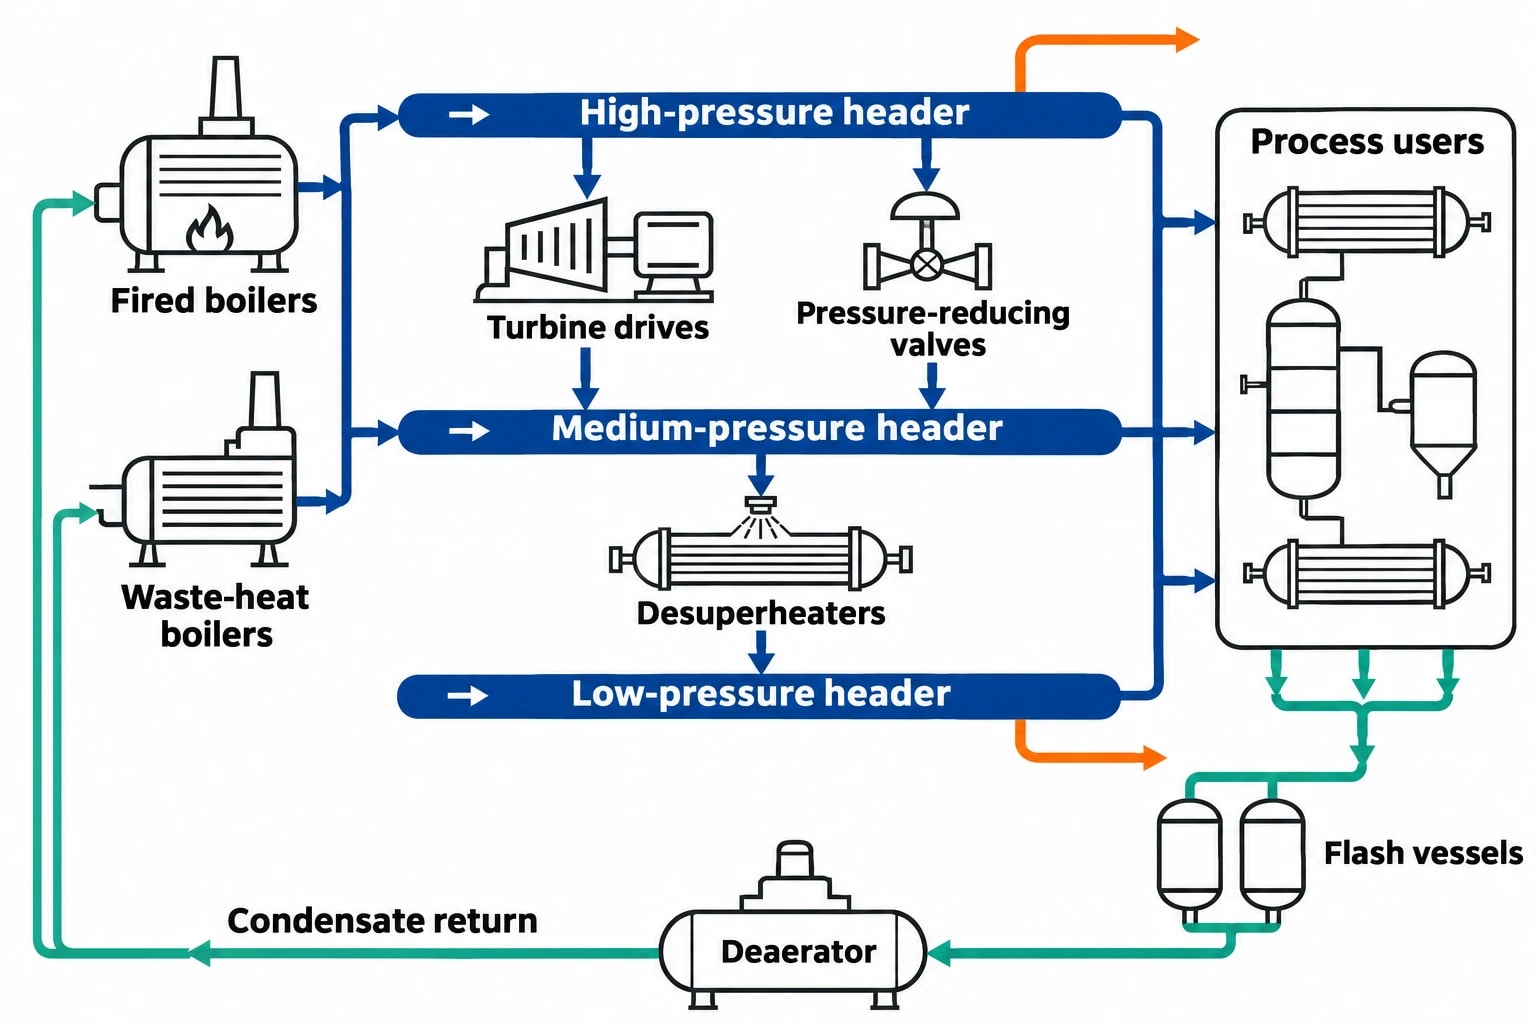
Refineries use several steam pressure levels because process duties differ widely. High-pressure steam may drive turbines or serve major process users. Medium-pressure and low-pressure headers commonly supply reboilers, stripping steam, tracing, atomisation, deaeration and other thermal duties. Pressure reduction produces useful lower-pressure steam, but it also destroys work potential when a turbine could generate power.
A steam map exposes these interactions. It allows the utilities team to test whether high-pressure steam generation, let-down, process demand and condensate recovery remain aligned through changes in crude slate, unit throughput, ambient temperature and equipment availability.
The value extends beyond fuel consumption. Poor steam balance can increase boiler loading, fuel-gas demand, demineralised-water use, cooling-water duty and combustion emissions. It can also reduce operating flexibility when a boiler trip, turbine outage or large process upset forces rapid changes in header pressure.
Commission Implementing Decision 2014/738/EU identifies energy-efficiency measures for mineral oil and gas refining. These include heat integration, waste-heat boilers, automated combustion control and systematic mapping of drain-valve systems to reduce steam consumption and optimise use. It frames steam mapping as an established refinery BAT measure rather than an isolated maintenance exercise.
Steam maps identify the real utility boundary
A narrow survey of boiler-house flowmeters can miss the loss mechanisms that shape the fuel bill. The mapping boundary should usually include:
- Fired boilers and waste-heat boilers
- Boiler-feedwater, deaerator and blowdown systems
- High, medium and low-pressure steam headers
- Turbine drives, pressure-reducing valves and desuperheaters
- Major process users, including reboilers, strippers and ejectors
- Steam tracing and tank-heating users where consumption is significant
- Condensate collection, flash vessels, polishing and return systems
- Vents, start-up drains, steam traps and drain valves
- Steam supplied to, or received from, neighbouring units
- Flare, relief and emergency depressurisation interfaces where steam can be routed or lost
The boundary must also state which flows are measured, estimated or unavailable. This prevents a spreadsheet from presenting assumptions as plant facts.

Map every energy and material flow in your process with detailed heat and mass balance calculations — the foundation for any optimisation or design project.
What a refinery steam map should contain
A useful steam map combines a physical network diagram with a reconciled data set. The diagram shows equipment, flow direction, pressure levels and interconnections. The data set records the conditions that determine energy content and operating consequences.
Core data for each steam stream
The field team should capture the same minimum information for generated steam, imports, exports, header flows, major users and condensate streams.
| Data item | Why it matters |
|---|---|
| Flow rate and measurement basis | Establishes mass balance and identifies metering gaps |
| Pressure and temperature | Determines steam condition and available enthalpy |
| Steam quality or superheat condition | Affects turbine, heating and desuperheating performance |
| Operating mode | Separates normal operation, start-up, shutdown and upset conditions |
| Source or destination | Connects a measured flow to the physical process duty |
| Measurement method | Shows whether the value comes from an instrument, calculation, laboratory result or operator record |
| Timestamp and averaging period | Prevents mixing steady operation with short transients |
| Data-confidence assessment | Focuses follow-up work on uncertain high-value streams |
Pressure is a key organising principle. A nominal header name alone is insufficient because pressure can drift with boiler control, turbine loading, process demand and pressure-reducing-valve position. A map should record the operating pressure range observed during the study, then distinguish normal variation from control instability.
Condensate needs equal status with steam
Steam users often receive detailed attention while condensate receives a single return-flow figure. That hides a major part of the balance. Returned condensate carries sensible heat, reduces boiler-feedwater treatment demand and limits the thermal shock associated with cold make-up water.
The map should establish where condensate returns at pressure, where it flashes, where it is cooled, where it is contaminated and where it is discharged. Process-side contamination may make return unsuitable without treatment, but the decision should follow evidence from the process, sample results and operating risk assessment.
Flash steam requires separate treatment. A condensate stream that drops from a higher pressure to a lower one can release flash steam. If the lower-pressure header has a suitable load, it may offset generated steam. If the header cannot accept it, the energy can leave through a vent or condenser.
How to build a defensible steam balance
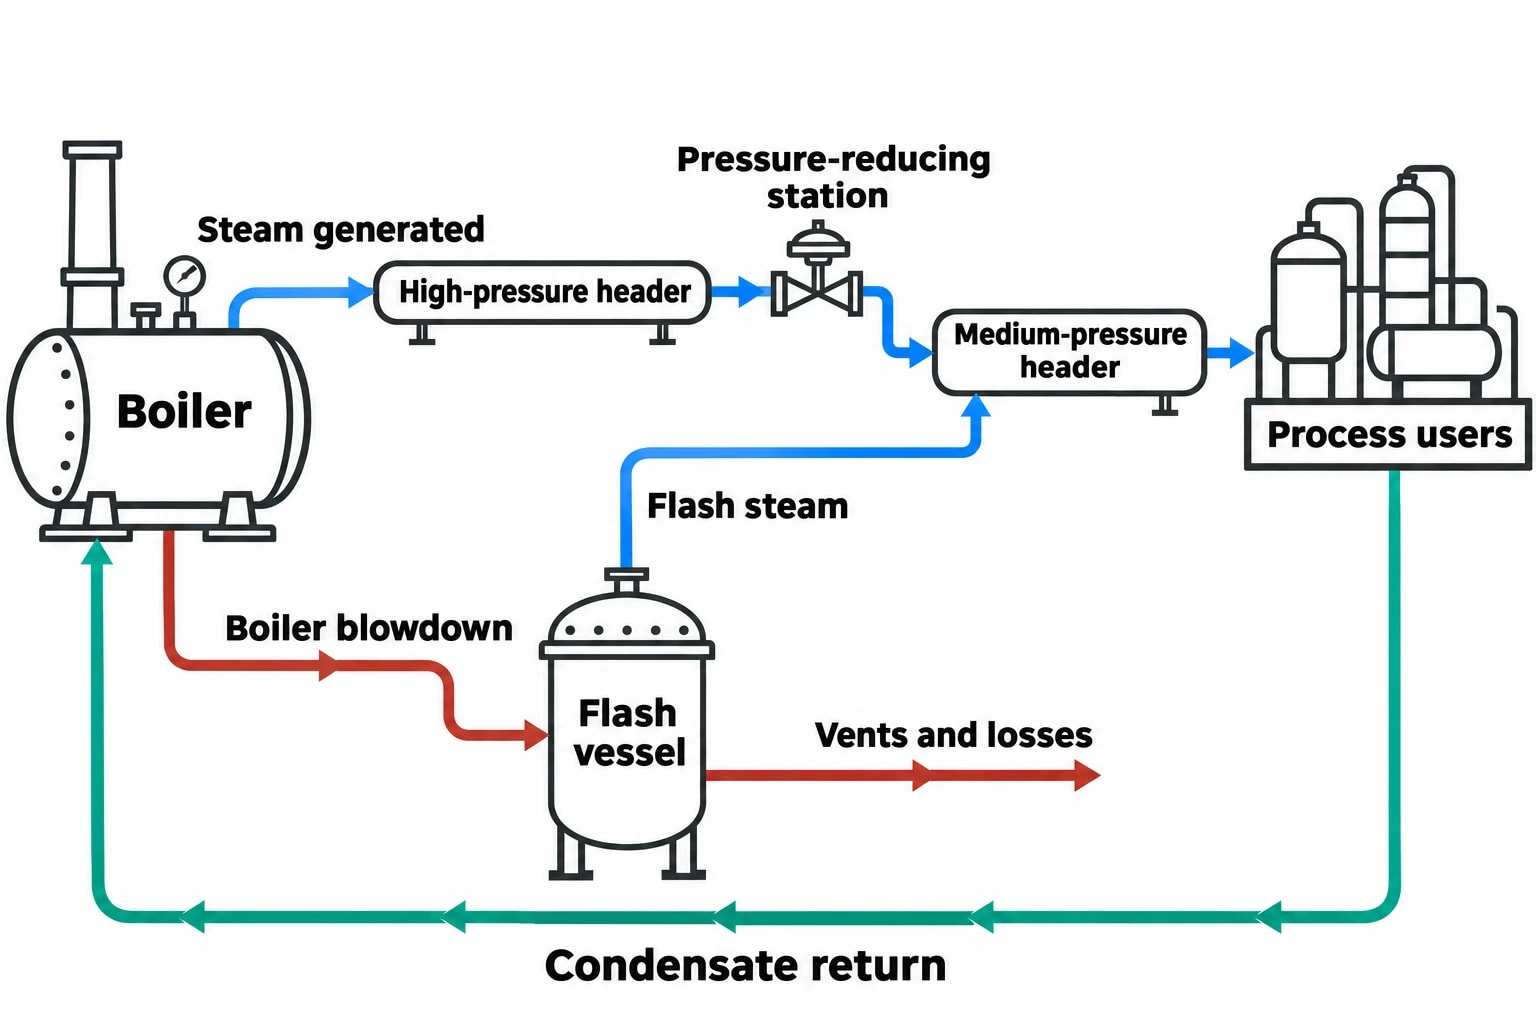
Refinery utility system optimisation relies on plant data that represent a stable, defined period. A map built from monthly fuel totals, one-off gauge readings and P&IDs from different revision dates will not reconcile reliably.
Start with the operating question
The study should state the operational decision before data collection. Typical questions include whether a medium-pressure header has sufficient margin after a turbine outage, whether boiler firing can be reduced through condensate recovery, or whether a pressure-reducing station is masking excess high-pressure generation.
The question defines the level of detail. A screening study may focus on the largest headers and users. A project supporting control changes, turbine investment or boiler modification needs more frequent measurements and clearer uncertainty bounds.
Verify the field network
P&IDs remain valuable, but field verification is essential. Temporary bypasses, isolated process lines, altered drain routes, damaged insulation, changed valve line-ups and undocumented tie-ins can materially change the utility balance.
Engineers should walk down the system with operations and maintenance personnel to confirm:
- Steam-header connections and normal valve line-ups
- Active and inactive users
- Drain and vent destinations
- Pressure-reducing stations and bypasses
- Meter locations, rangeability and maintenance status
- Condensate return paths and flash vessels
- Boiler blowdown routes
- Temporary hoses, start-up arrangements and seasonal tracing loads
The walkdown often reveals a difference between the drawing and the running refinery. That difference should be controlled through the site management-of-change process where appropriate.
Reconcile mass and energy before ranking projects
A balanced map compares steam generated with steam consumed, exported, condensed, vented and otherwise accounted for. It also compares thermal energy entering each part of the network with useful duty delivered, recovered heat and identifiable losses.
The reconciliation process should challenge implausible readings before assigning an efficiency opportunity. A flowmeter with poor installation, a transmitter at the lower end of its range or a density assumption applied to wet steam can create an apparent loss that does not exist.
Once engineers reconcile the balance, they can rank opportunities by annual fuel, power and water impact; emissions effect; capital requirement; operational risk; and outage requirement. This avoids selecting a low-cost intervention that compromises header stability or process reliability.
Where steam maps commonly reveal losses
Steam losses take different forms. Some are visible, such as a vent plume or leaking flange. Others are hidden in recurring control actions, unattended drains, poor condensate segregation or chronic pressure reduction.
Uncontrolled drains, vents and steam traps
Commission Implementing Decision 2014/738/EU identifies systematic drain-valve mapping as a refinery energy-efficiency technique. A practical programme identifies each drain point, its purpose, normal position, destination, ownership and inspection status.
Drain valves can be necessary for start-up, warm-up, water removal and safe isolation. A valve left open after its intended duty can pass valuable steam continuously. Steam traps require a different inspection approach because correct operation depends on the application, differential pressure, backpressure, condensate load and discharge arrangement.
A complete register should distinguish:
- Start-up drains
- Continuous process drains
- Instrument and impulse-line drains
- Steam-trap discharges
- Safety-valve and relief-system interfaces
- Vents from flash vessels and deaerators
- Temporary drains used during maintenance or commissioning
The register should link each item to a location, service, downstream destination and field inspection result. This gives operations an auditable route to close or repair known losses without obscuring safety-critical functions.
Excess pressure reduction
A pressure-reducing valve meets a legitimate operating need when the network requires lower-pressure steam. Persistent let-down from a high-pressure header can, however, indicate a mismatch between steam generation and demand.
Potential causes include a turbine operating at low load, a turbine bypass left in service, changes in process steam demand, a failed control valve, reduced turbine availability or a boiler minimum-load constraint. The appropriate response depends on the whole utility system. Reducing boiler firing may affect header pressure, turbine steam supply and process reliability.
Low condensate return and high make-up demand
Low condensate return increases demand for treated make-up water and boiler-feedwater heating. It can also increase wastewater handling where condensate is discarded or cooled before discharge.
The steam map should separate clean condensate, potentially contaminated condensate and known-contaminated condensate. This classification supports an engineering review of return opportunities while maintaining process safety and boiler-water quality requirements.
Boiler and combustion losses
The EU Refining BREF states that well-maintained, operated direct-fired heaters and boilers can achieve thermal efficiencies above 85%. It states that efficiency can reach 93% where air preheat is applied and flue gas is cooled close to its dew point.
These figures explain why boiler performance belongs within steam mapping. The map connects steam demand to boiler firing and enables a clearer review of excess oxygen, stack temperature, air leakage, boiler loading, blowdown and feedwater temperature. Automated combustion control and heat integration are also identified in the Refining BAT Conclusions as energy-efficiency measures.

Map every energy and material flow in your process with detailed heat and mass balance calculations — the foundation for any optimisation or design project.
Turning the map into an optimisation programme
A steam map gains operational value when the refinery converts findings into defined actions, ownership and verification. The programme should prioritise changes that protect production and account for the practical limits of process equipment.
Prioritise operational actions first
Many improvements emerge from operating discipline and maintenance rather than major capital works. Examples include restoring a failed condensate return route, repairing a leaking isolation valve, correcting a drain-valve line-up, repairing insulation, resetting a pressure controller within approved limits or returning a turbine bypass to its intended normal condition.
Each action needs a named owner, process-safety review where required, target date and verification method. Verification should compare conditions before and after the change using a defined operating basis. Boiler fuel intensity, header pressure, steam flow and production throughput should be reviewed together.
Develop projects from a validated balance
Capital projects require a stronger evidence base. The refined steam map can support assessment of:
- Additional condensate recovery and flash-steam recovery
- Boiler-feedwater heat recovery
- Boiler air preheat and flue-gas heat recovery
- Turbine refurbishment or revised steam-turbine operating strategy
- Heat integration between process streams and utility demands
- Boiler control improvement and metering upgrades
- Waste-heat boiler availability or debottlenecking
- Process changes that reduce stripping-steam or reboiler demand
The HMB model should retain the assumptions that produced the proposed saving. Fuel composition, crude slate, product rate, ambient conditions, steam pressure and equipment availability all influence the result. A project model without those conditions can overstate expected benefit.
Heat and mass balance methods for steam mapping
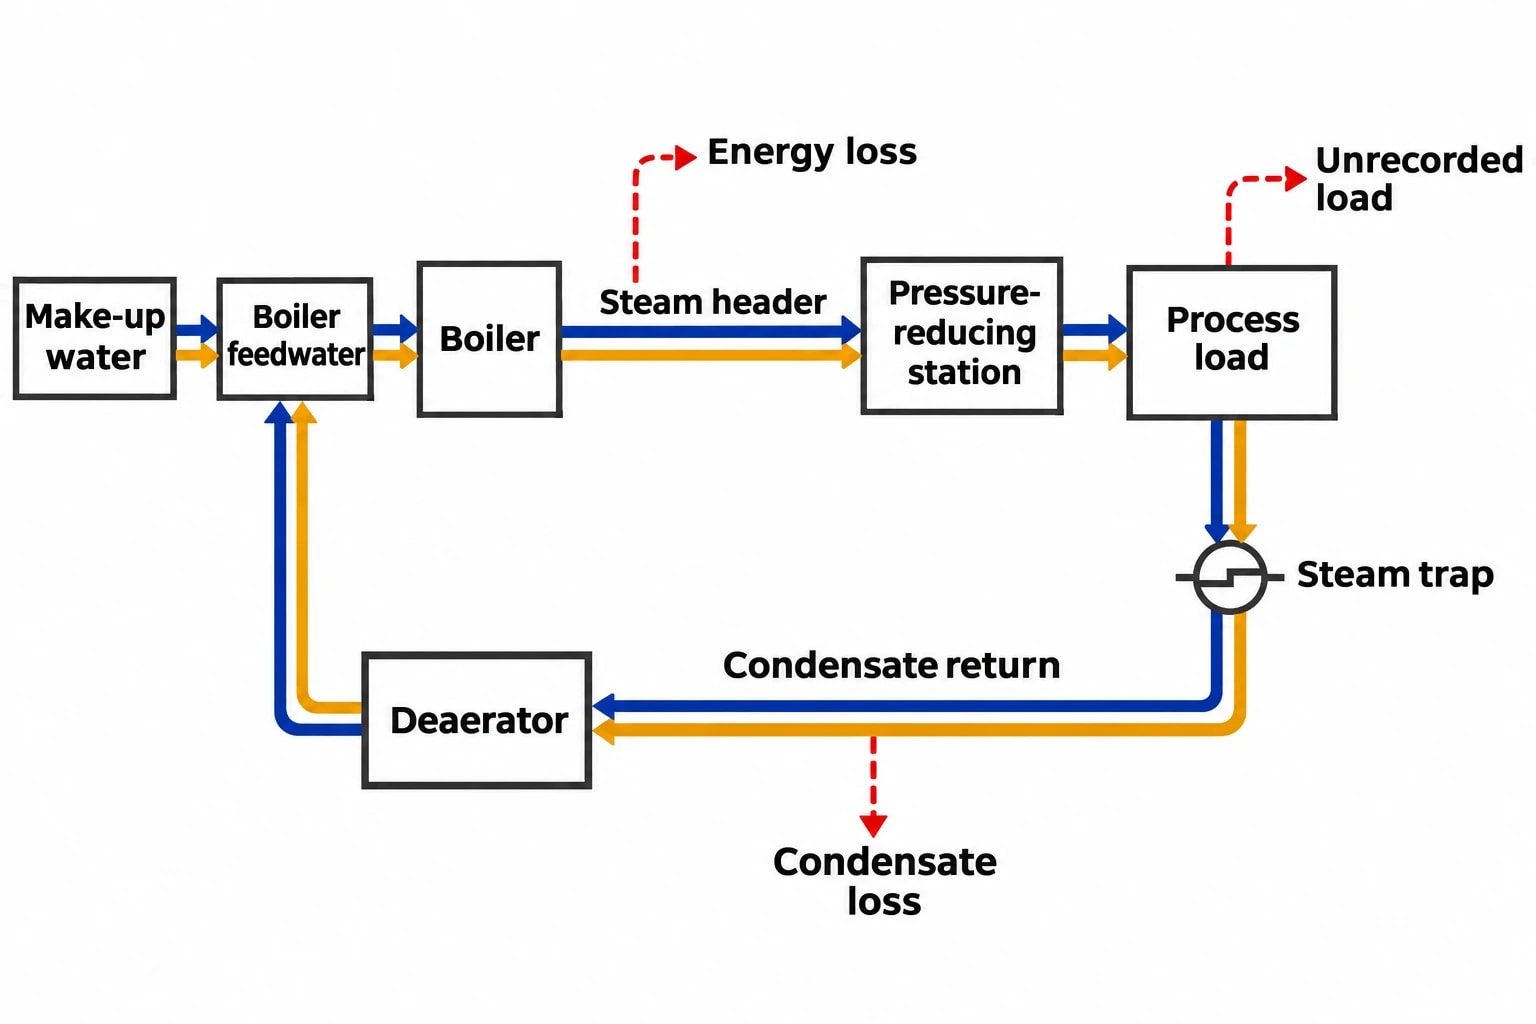
Steam mapping is an applied heat and mass balance exercise. The mass balance tracks water and steam through generation, use, return and loss. The energy balance tracks enthalpy through the same network. Together, they identify whether an apparent steam shortfall is a metering issue, a condensate loss, an unrecorded process load or a genuine energy loss.
EnerTherm Engineering’s 11-step methodology provides a structured route from scope definition and data gathering through field validation, steady-state modelling and FEED-ready documentation. For a refinery utility study, the deliverable should include a single-source-of-truth process flow diagram with stream tables, assumptions, operating cases and a reconciled utility balance.
The document should identify the constraints around each recommendation. A header-pressure change may affect a stripper. A condensate-recovery project may require segregation from hydrocarbon-contaminated drains. A boiler-efficiency project may change flue-gas conditions and require corrosion assessment.
Use operating cases, not a single annual average
Refinery utilities rarely operate at one steady condition. A credible study should capture representative cases such as normal maximum throughput, reduced throughput, major unit start-up, a turbine unavailable, winter tracing demand and a high steam-demand process campaign.
The result helps operations make decisions during changing plant conditions. It can show which headers have margin, which pressure-reducing stations become limiting and where a temporary change could create a fuel, power or reliability penalty.
Compliance and management requirements in the UK and Europe
Steam-system optimisation supports compliance work, but it does not replace permit, safety or reporting obligations. Refinery operators should integrate the mapping programme with relevant environmental-management, energy-management and pressure-system controls.
For EU refineries, Commission Implementing Decision 2014/738/EU remains a key reference for BAT Conclusions covering mineral oil and gas refining. It identifies systematic drain mapping, combustion control, heat integration, combined heat and power, and waste-heat recovery among the techniques relevant to energy performance.
For UK operators, the Energy Savings Opportunity Scheme Regulations 2014 provide the framework for ESOS. Phase 3 participants must cover at least 95% of total energy consumption through an energy audit or alternative compliance route. The second Phase 3 progress update is due by 5 December 2026. A reconciled refinery steam map supplies stronger evidence for defining significant energy consumption, selecting measures and estimating reported savings.
ISO 50001:2018, confirmed as current by ISO in 2024, provides an energy-management framework for setting objectives, measuring energy performance and reviewing improvement actions. Steam-map indicators can support that cycle when the site defines clear baselines and controls for production changes.
Steam systems also sit within the UK Pressure Systems Safety Regulations 2000. HSE states that steam at any pressure is a relevant fluid under the Regulations. Dutyholders need to understand safe operating limits and ensure an appropriate written scheme of examination is in place where required. Utility optimisation must remain within approved operating limits and established safety procedures.
This article reflects the independent analysis and editorial opinion of EnerTherm Engineering. Product names, trademarks, and brands mentioned belong to their respective owners. EnerTherm Engineering is not affiliated with, endorsed by, or a licensee of any third-party software or product mentioned unless explicitly stated.

Technical Manager — EnerTherm Engineering
John Naranjo is Technical Manager at EnerTherm Engineering, bringing specialist expertise in chemical and environmental engineering. He recently led the implementation of Omni Vision, EnerTherm's real-time energy and utility monitoring platform. He holds an MSc in Environmental Engineering from the University of Huelva and a BSc in Chemical Engineering, with memberships in both the Energy Institute and IChemE.
