Why Textile Mills Need Energy Management Systems for BAT 11
How sub-metering links MWh per tonne to stenter and dyeing performance
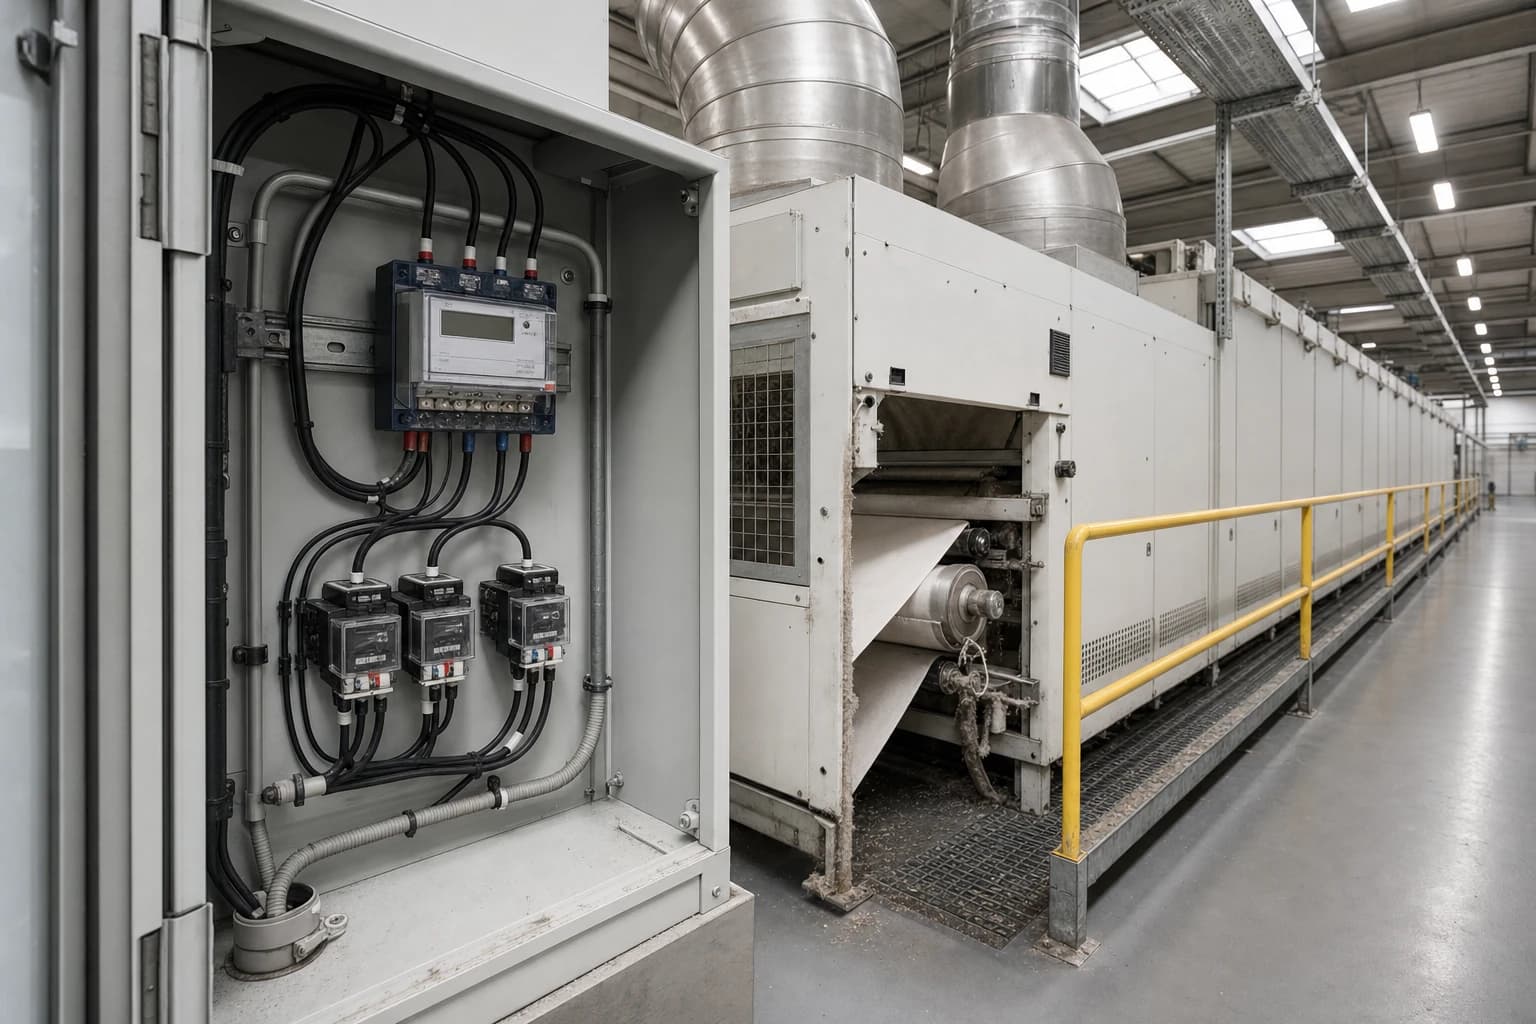
A textile mill energy management system combines metering, production data, analysis and operational review to measure energy use against textile output and support continual improvement. Commission Implementing Decision (EU) 2022/2508 makes the requirement explicit for affected European textile installations. BAT 11 requires an energy-efficiency plan and audits, supported by plant and process energy-flow diagrams, energy-efficiency objectives such as MWh per tonne of textile processed, and actions to achieve them. Audits must take place at least annually, with recommendations followed through. That changes the purpose of monitoring. A monthly utility bill can show total spend, but not whether a stenter used excessive exhaust air during a short run, a dye house heated more water than a batch required, or steam losses rose after a condensate-return fault. A textile mill energy management system supplies evidence to identify, prioritise and verify such issues without turning production into a series of trial stoppages. ## What BAT 11 requires from textile energy management 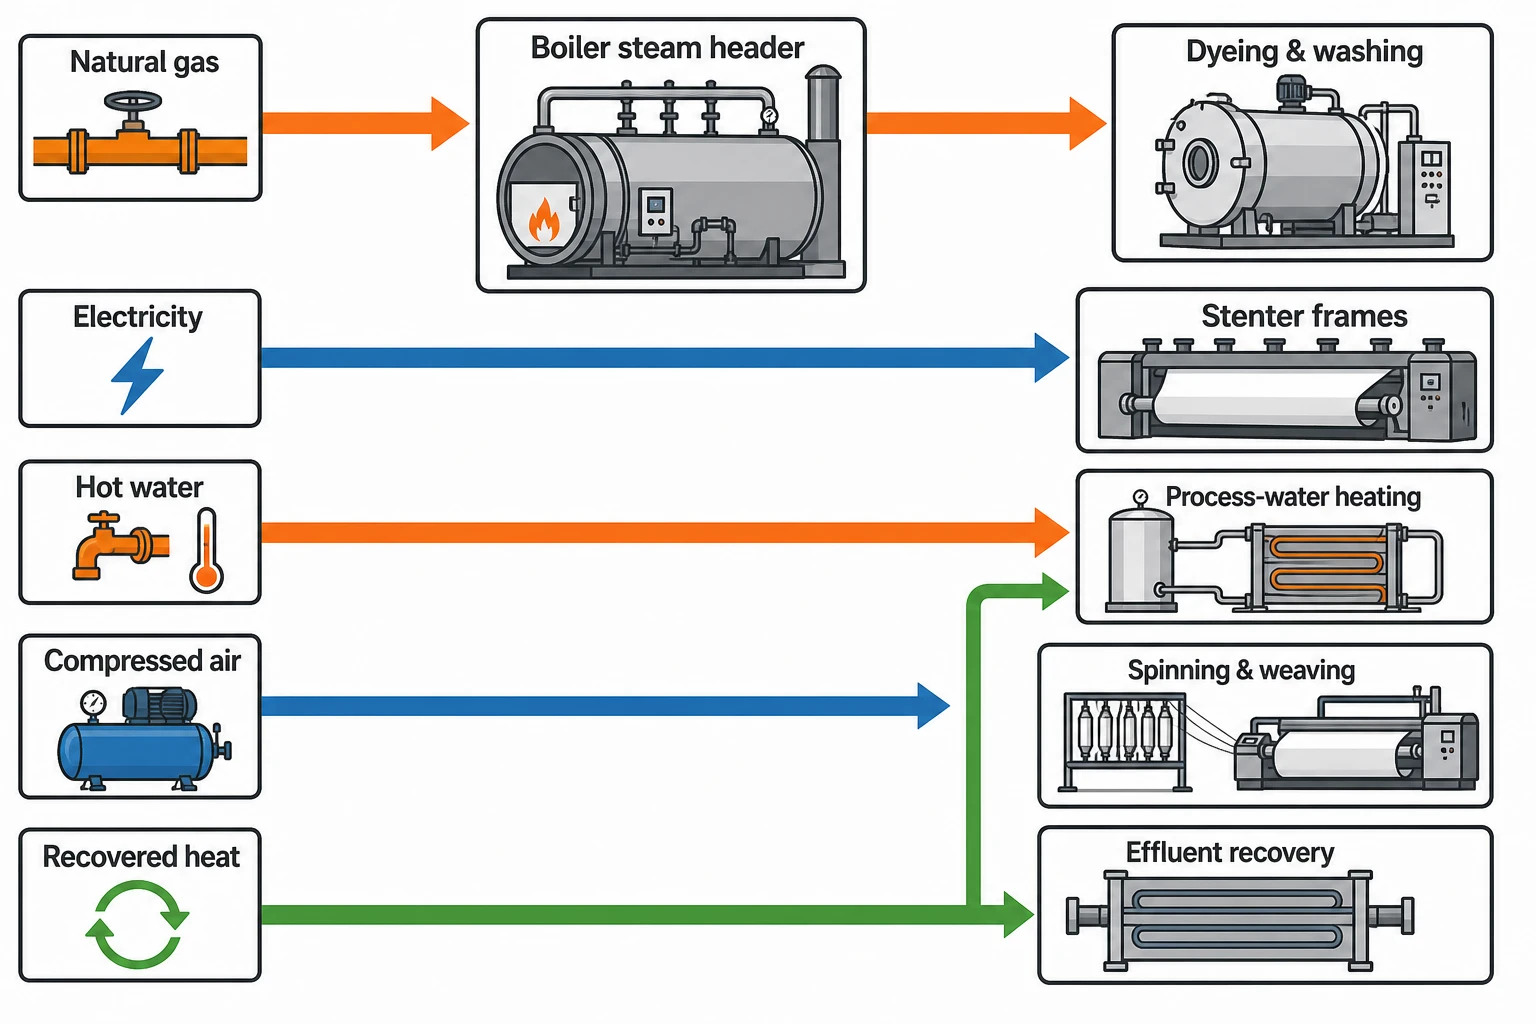 BAT 11 sits within the environmental management system requirements for the textiles industry. It focuses on energy efficiency across the plant rather than a one-off project on a boiler, dryer or motor. ### Energy-flow diagrams must reflect the real plant BAT 11 calls for energy-flow diagrams of plants and processes as part of the inventory of inputs and outputs. For a textile mill, the diagram should account for electricity, natural gas, steam, hot water, compressed air and recovered heat from supply to the consuming process. A useful energy-flow diagram separates major energy users, including: - Stenter frames and dryers - Dyeing machines, jet dyeing equipment and washing ranges - Boilers, steam distribution and condensate recovery - Hot-water generation and process-water heating - Compressed-air systems - Spinning, weaving and finishing machinery - Effluent treatment and effluent heat-recovery equipment - Extraction fans and make-up air systems The aim is traceability. An energy manager should be able to trace use from a site gas meter to a dye-house steam header, then to process areas and, where warranted, to a particular machine or production line. ### Objectives must use a meaningful production denominator BAT 11 gives MWh per tonne of textile materials processed as an example objective. This is more useful than a site-wide kWh figure because textile output changes with order mix, fabric weight, moisture content, batch size and finishing route. A plant that processes a high proportion of heavy, wet fabric consumes energy differently from one running lightweight synthetic fabrics. The energy management system therefore needs reliable production context alongside meter data. Tonnes processed, fabric width, wet pick-up, recipe, target moisture, batch duration and operating hours can explain legitimate changes in consumption. ### Annual audits need evidence of follow-up Annual auditing is the minimum BAT 11 frequency. The audit must test whether objectives have been met and whether previous recommendations have been implemented. A monitoring platform provides time-stamped data before and after a change, while operational records document the change itself. This matters when projects overlap. A boiler tune, revised stenter recipe and reduced idle time may all affect gas use during the same quarter. Without a defined baseline and production records, the mill cannot credibly separate their effects. ## Why utility bills cannot manage textile process energy Utility billing data arrives too late and aggregates too much. It is suitable for cost reconciliation but weak evidence for process management. ### Textile energy use changes within a shift A stenter may run at different widths, temperatures and fabric speeds during one shift. A jet dyeing machine may heat, hold, drain, refill and rinse during a batch. Boilers respond to changing steam demand while carrying distribution losses, blowdown and poor condensate return. The daily total may look normal even when one production period performed badly. Interval data exposes the pattern. It can reveal high base load during breaks, extended warm-up periods, compressed-air demand outside production hours and steam demand that persists after a wet process has finished. ### Throughput alone is not enough Tonnes are essential, but they do not remove all variation. Textile mills should link energy data to the factors that drive the process. | Process area | Energy data | Production and condition data | |---|---|---| | Stenter | Gas or thermal energy, fan electricity, exhaust airflow | Fabric width, speed, inlet moisture, target moisture, product grade | | Dye house | Steam, gas, electricity, hot-water flow | Batch mass, liquor ratio, recipe, dyeing temperature, number of rinses | | Boiler house | Fuel, steam generation, feedwater, condensate return | Steam pressure, operating hours, blowdown, return temperature | | Washing and pretreatment | Hot-water energy, water flow, pumping electricity | Tonnes processed, wash stages, water temperature, line speed | | Compressed air | Compressor electricity, air flow and pressure | Production status, operating hours, leak-survey results | This structure allows the plant to compare like with like. It also prevents misleading conclusions, such as treating a higher energy total as poor performance when the mill ran more tonnes, wider fabric, wetter feed or a more demanding finish. ### Batch scheduling belongs in the energy plan BAT 11 identifies optimised scheduling of batches for thermal treatment as an energy-efficiency technique. Thermal equipment consumes energy during warm-up and idling as well as productive processing. Short, scattered jobs can leave stenters, dryers and dyeing machines hot but underused. An energy management system can identify the cost of that pattern. It can flag demand during idle periods and compare energy intensity by batch sequence, shift and product family. Production planners can then group compatible work where quality, delivery dates and process constraints allow it. This reduces thermal idling and provides evidence that scheduling decisions support the energy-efficiency plan. ## Where textile sub-metering produces the best evidence 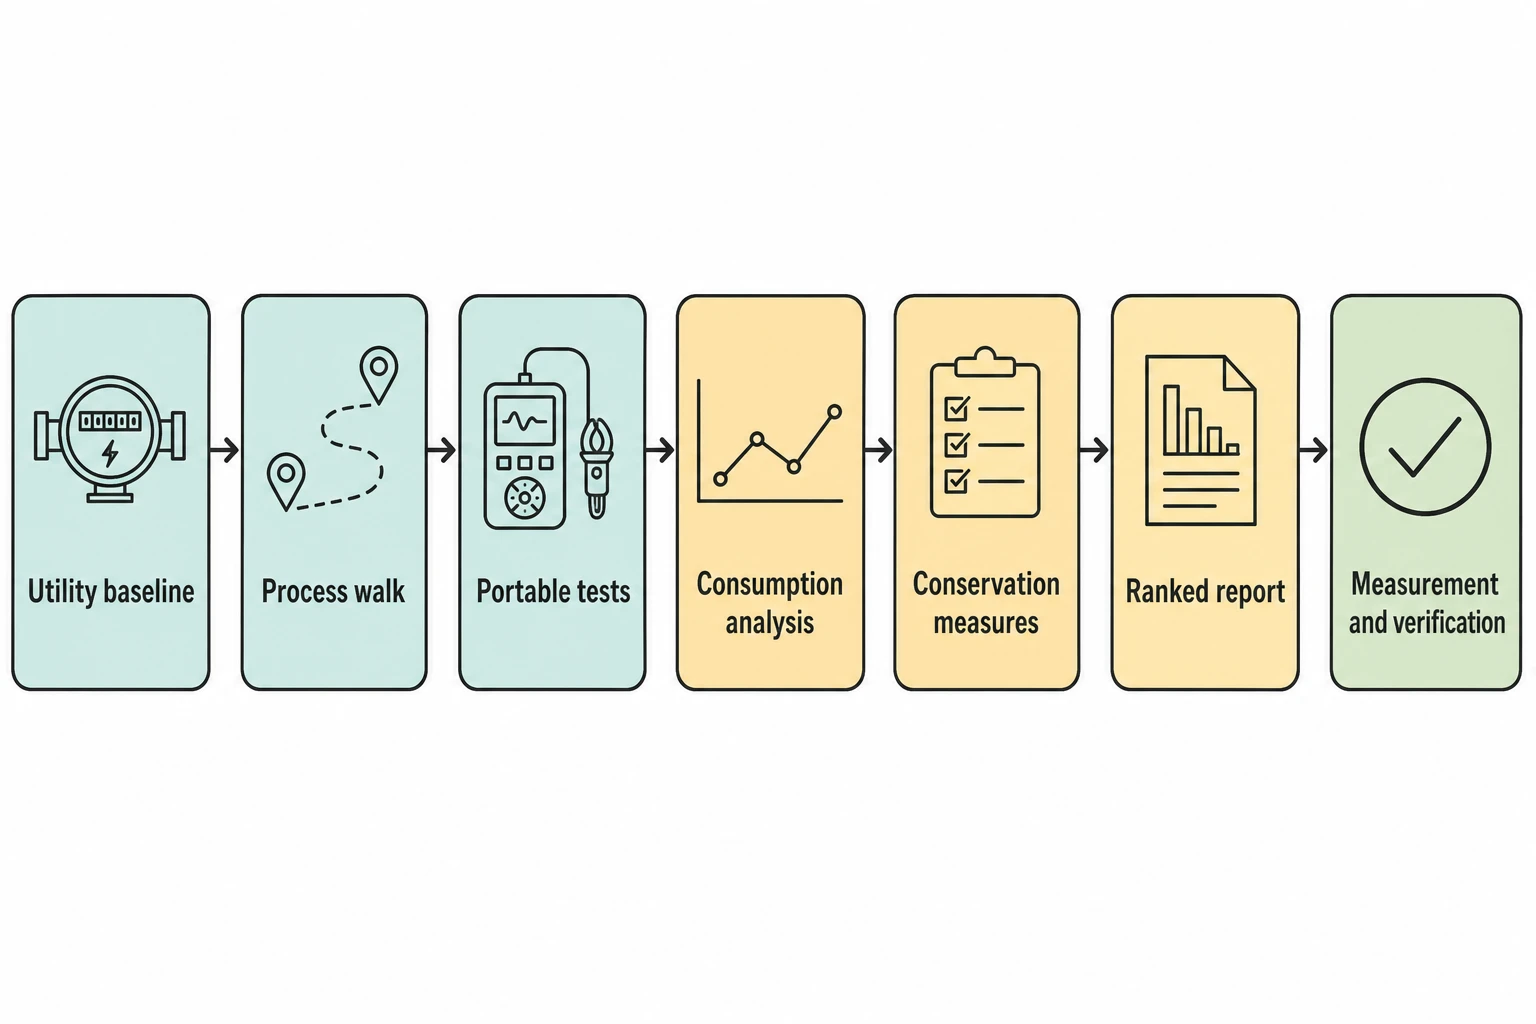 A mill does not need a meter on every motor before it can manage energy. It needs enough coverage to isolate material energy uses, relate them to output and target investigation. ### Start at the site boundary and major utilities The first layer should capture purchased electricity and fuel at the site boundary. The next should measure major utility generation and distribution points: boilers, steam headers, hot-water circuits, compressed-air compressors and principal process areas. For a gas-fired boiler house, meters or recorded measurements should establish fuel input, steam output, feedwater quantity and condensate return. For electrical systems, relevant information often includes kWh, demand, running hours and load profile. A power analyser used during an audit can identify intermittent loads before permanent meters are specified. ### Meter thermal treatment separately The 2023 EU Textiles BREF identifies thermal treatment as a major area for energy management. It gives an indicative yearly specific energy-consumption range of 0.5 to 4.4 MWh per tonne for thermal treatment. The range is an indicator for the defined process, not a universal target for a whole textile mill. Product type, water-removal duty and equipment configuration affect performance. Stenter monitoring should bring together fuel use, exhaust flow, fan electricity, fabric speed, fabric width and moisture conditions. BAT 13 covers drying performance, including monitoring and operational control of inlet-air and exhaust-air humidity and temperature, textile and dryer-air temperature, residual fabric moisture, and exhaust airflow. These process variables explain why two runs with similar tonnes can have very different energy intensity. ### Follow heat and water through wet processing Wet processes carry energy in hot water, liquor, steam, condensate and effluent. A dye-house energy management system should therefore record water flow and temperature with the heat source supplying it. Water data alone identifies volume. Pairing water flow with inlet and return temperatures identifies heating demand and opportunities to reduce it. Effluent heat recovery requires the same discipline. The monitoring boundary should include the hot effluent source, heat exchanger, recovered-heat destination and any supplementary heat source. Otherwise, a lower boiler load may be mistaken for recovery when a production change caused it. ### Use portable instrumentation before permanent installation Permanent sub-metering should follow an audit, not guesswork. Portable power analysers, ultrasonic leak detectors and thermal imaging can establish where a fixed measurement point will produce useful information. An audit sequence can proceed without disrupting routine production: 1. Establish the utility baseline and production record. 2. Walk the process with operators and map energy flows. 3. Use portable instruments to test suspected high-load and loss points. 4. Analyse consumption against throughput, recipes and operating hours. 5. Identify conservation measures, including operational changes and capital projects. 6. Prepare a ranked report with practical implementation steps. 7. Verify results through ongoing measurement and verification. This sequence links a meter to a decision. A meter installed without a defined question often produces dashboards that nobody uses. ## How ISO 50001 strengthens BAT 11 delivery ISO 50001:2018, amended by ISO 50001:2018/Amd 1:2024, provides a suitable management framework for the work BAT 11 expects. It addresses how an organisation establishes, implements, maintains and improves an energy management system. ### Turn BAT targets into energy performance indicators The standard supports energy performance indicators and energy baselines. For textile operations, a single site indicator is rarely sufficient. A practical set can include: - MWh per tonne of textile processed for the relevant plant area - Thermal energy per tonne through a stenter or dryer - Steam per tonne processed in the dye house - Condensate return rate against steam generation - Hot-water energy per batch or per tonne - Compressor electricity during production and non-production hours Each indicator needs a named owner, agreed data source and review frequency. Operations directors need the site view, while a stenter operator needs the measure for that stenter. The system should provide each person with the measure they can influence. ### Baselines must account for changing operating conditions An energy baseline that ignores production changes produces false alarms and false savings. Mills should define relevant variables before setting targets. Common variables include processed mass, product type, batch mass, inlet moisture, ambient conditions where they materially affect drying, operating hours and fabric width. The baseline should also have a clear period and boundary. If a project improves condensate return, the boundary may include the boiler and condensate system. If a project reduces stenter exhaust flow, the boundary may focus on that stenter’s fuel and electrical use, with fabric production and moisture conditions recorded. ### Management review gives data operational force Data collection alone does not improve performance. ISO 50001 places energy performance within management review and continual improvement. For a textile mill, the energy manager, production team and maintenance team should review exceptions together. A monthly review should distinguish between: - A process deviation requiring immediate operator action - A maintenance issue, such as a failed steam trap, air leak or fouled heat exchanger - A scheduling issue creating avoidable idle running - A capital opportunity requiring feasibility work - A reporting change caused by a different product mix That discipline turns annual BAT auditing into a review of an active programme rather than a reconstruction of events after the fact. ## Measuring savings from textile energy projects 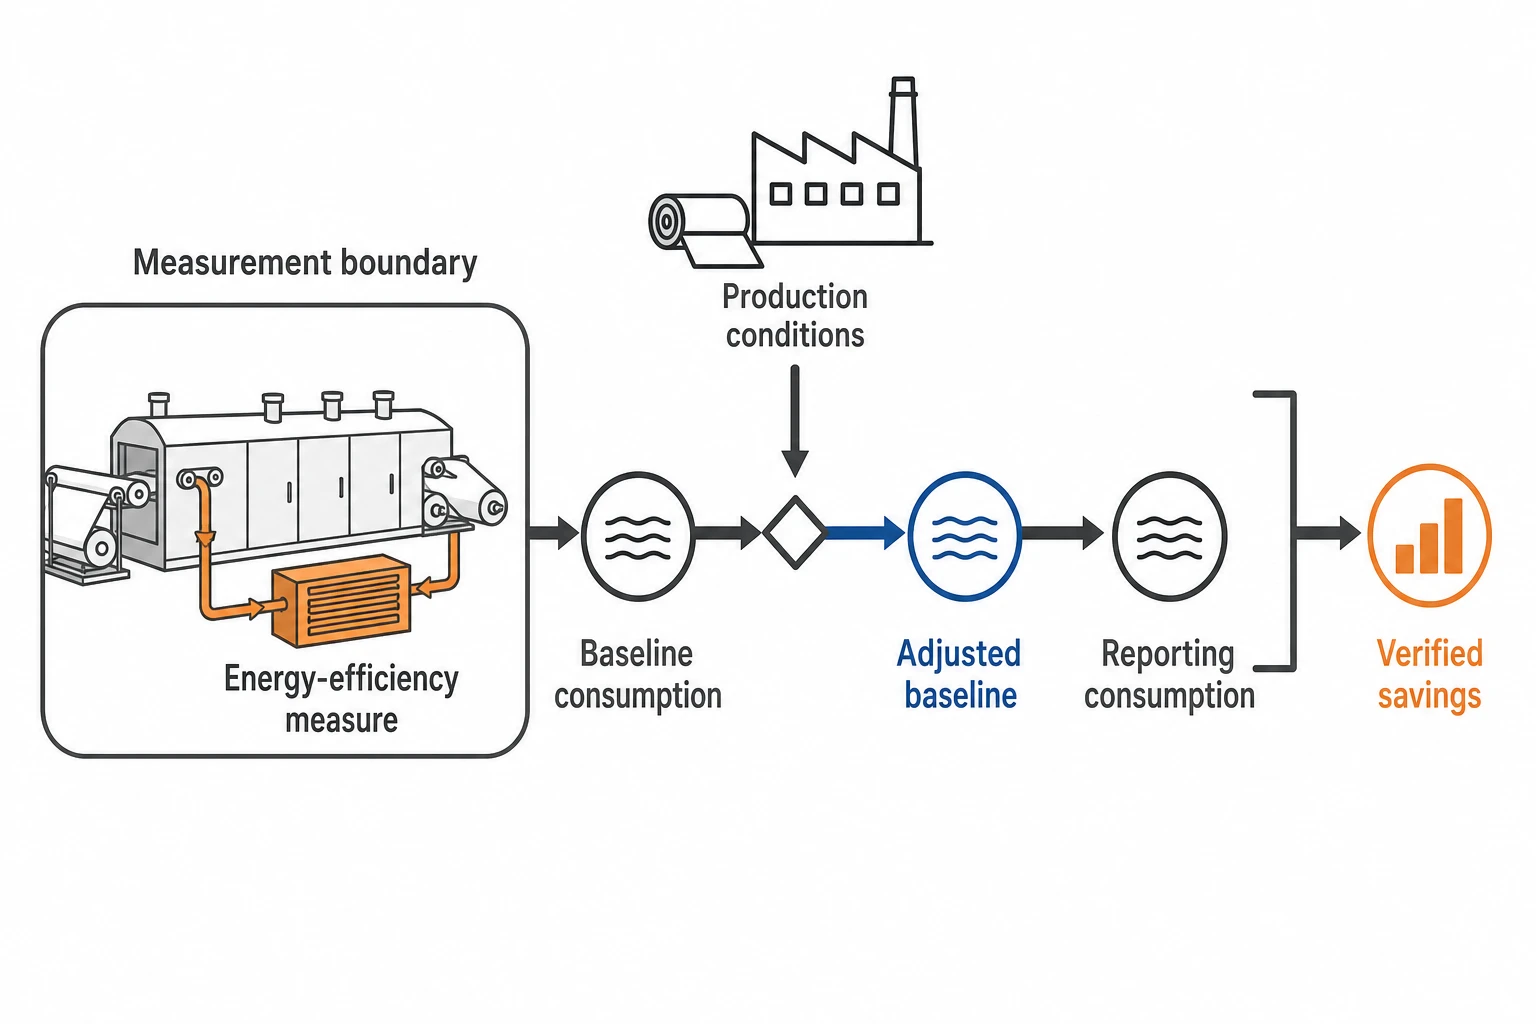 Energy savings cannot be directly metered because they represent consumption that did not occur. IPMVP Core Concepts 2022 sets out the established approach: compare measured consumption before and after an energy-efficiency measure within a defined measurement boundary, then adjust for material changes in conditions. ### Define the measure before claiming its result A stenter heat-recovery project may affect burner fuel, exhaust-fan electricity and supplementary heating demand. A boiler improvement may affect gas, electricity, feedwater and condensate return. The monitoring plan should identify each affected energy source before implementation. For an operational measure, the plan should also define the change. “Operator awareness” is too broad for measurement and verification. “Reduced stenter exhaust airflow during defined idle conditions” can be measured, reviewed and maintained. ### Match the reporting boundary to the decision IPMVP allows different boundaries. A narrow boundary suits a specific machine. A whole-facility boundary suits a package of measures with interacting effects. Textile mills frequently need both. A narrow measurement boundary can verify improved dye-machine heating performance. The whole-facility view can show whether several measures lowered annual utility consumption and cost. Using both prevents a local improvement from being obscured by a different production mix elsewhere on site. ### Keep the evidence ready for the annual audit The annual BAT 11 audit should be able to retrieve: - The current energy-flow diagram - Energy-intensity objectives and thresholds - Meter coverage, data-quality checks and missing-data treatment - Production variables used to interpret performance - The action register and responsible owners - Evidence of completed measures - Before-and-after results with documented adjustments - Outstanding actions, risks and review dates This gives a mill a repeatable method for finding waste in stenters, dye houses, boilers and drying operations, then proving whether an intervention delivered the expected result. ## BAT 11 is becoming a UK operating priority Commission Implementing Decision (EU) 2022/2508 sets the EU textiles BAT conclusions and covers pretreatment or dyeing operations above 10 tonnes per day under Annex I, point 6.2, of Directive 2010/75/EU. The BREF also addresses directly associated textile activities, including finishing, fabric production and certain spinning operations. UK requirements need permit-specific review against the applicable regulator guidance. For UK operators, the European BAT 11 model remains a useful technical benchmark, particularly where a mill supplies EU customers, operates within a wider European group, or needs a disciplined evidence base for its environmental permit and capital plan. --- This article reflects the independent analysis and editorial opinion of EnerTherm Engineering. Product names, trademarks, and brands mentioned belong to their respective owners. EnerTherm Engineering is not affiliated with, endorsed by, or a licensee of any third-party software or product mentioned unless explicitly stated.

Managing Director — EnerTherm Engineering
Dr. François Pierrel is Managing Director of EnerTherm Engineering with over two decades of expertise in thermal design, heat transfer, and industrial energy optimisation. He holds a PhD in Heat Transfer from Cranfield University and a Post-Doctorate from Heriot-Watt University.
