Pinch Analysis Cuts Process Thermal Demand by 15-30%
An ESOS framework for optimising heat networks and targeting minimum utilities.
Pinch analysis for energy efficiency is a systematic thermodynamic methodology that minimises industrial utility consumption by designing and optimising heat exchanger networks based on calculated thermodynamic limits. The method identifies the maximum potential for internal heat recovery within a process, establishing precise energy targets before any physical modifications are made to the pipework or heat exchangers. Rather than relying on trial and error, process engineers use this thermodynamic framework to determine the exact minimum quantities of hot and cold utilities required by a plant.
Defining the Thermodynamic Bottleneck
The core of this methodology is the identification of the pinch point, which represents the thermodynamic bottleneck of the process. At this specific temperature level, the heat transfer driving force between the hot streams requiring cooling and the cold streams requiring heating is at its minimum allowable limit. This temperature difference, known as the minimum approach temperature (ΔTmin), acts as a boundary that constrains heat integration. Understanding the pinch point prevents engineers from making inefficient design choices, such as transferring heat across this thermal barrier, which inevitably increases the external utility requirements.
Historical Development and Industrial Success
The concept of process integration through pinch technology originated in the early 1970s. Edward C. Hohmann first established the relationship between process temperatures, enthalpies, and heat recovery network optimisation in his 1971 doctoral dissertation. The methodology gained global industrial traction in the late 1970s when B. Linnhoff and J.R. Flower expanded the mathematical framework to address skyrocketing oil prices. Since then, manufacturing facilities worldwide have applied these principles to reduce thermal demand, improve operating margins, and lower industrial emissions. Modern process plants rely on these thermodynamic targets to benchmark their current energy performance against the theoretical maximum recovery limits.
Core Thermodynamic Principles of Heat Recovery Networks
Process integration relies on the fundamental laws of thermodynamics to structure how heat moves through a manufacturing facility. To perform an assessment, engineers categorise all process streams into two groups: hot streams, which must be cooled down, and cold streams, which must be heated up. The thermal interaction between these streams dictates the overall energy demand of the site.
Hot and Cold Composite Curves
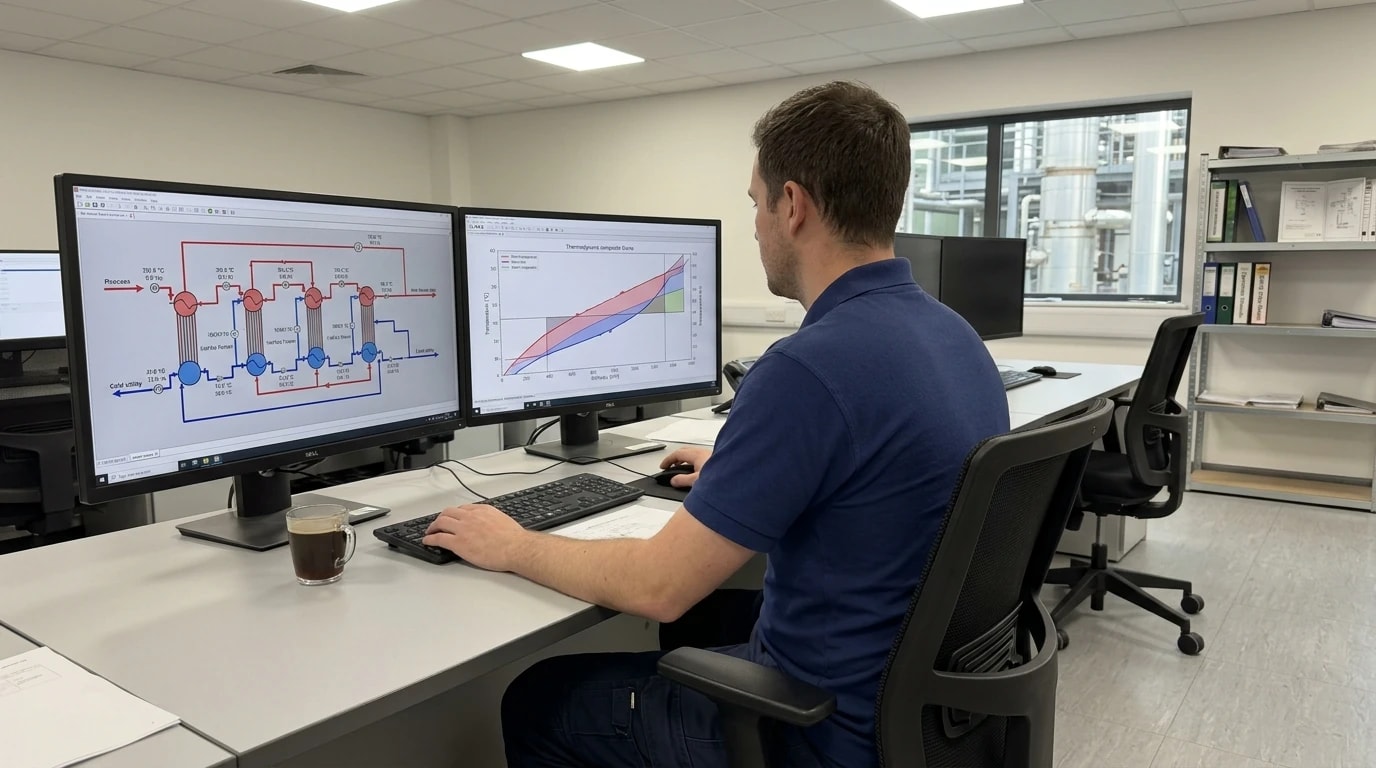
The first step in a pinch analysis involves constructing composite curves. Process engineers compile the temperature and enthalpy data of all hot streams in the plant into a single hot composite curve on a temperature-enthalpy (T−H) diagram. The same aggregation is performed for all cold streams to produce a single cold composite curve. When plotted together, these two curves display the total heat availability and heat demand across different temperature ranges. The vertical distance between the curves represents the temperature difference available for heat exchange. The region of overlap between the hot and cold composite curves represents the maximum heat recovery potential within the plant.
The Physical Significance of the Pinch Point
The point where the hot and cold composite curves are closest represents the pinch point. This location defines the thermal limit of the process. The pinch temperature divides the entire manufacturing process into two thermodynamically distinct zones:
- The region above the pinch: This zone behaves as a net heat deficit, requiring external heating (hot utilities like steam or thermal oil) to balance its energy requirements.
- The region below the pinch: This zone behaves as a net heat surplus, requiring external cooling (cold utilities like cooling water or chilled glycol) to remove excess energy.
Because the heat transfer driving force reaches its minimum at the pinch, no heat can be transferred across this point without incurring an energy penalty.
The Three Golden Rules of Pinch Design
To achieve the minimum utility targets identified by the composite curves, the design of the heat exchanger network must strictly adhere to three thermodynamic rules:
- Do not transfer heat across the pinch point: Introducing a heat exchanger that transfers thermal energy from a stream above the pinch to a stream below the pinch violates the system balance. This transfer increases both the hot utility demand and the cold utility demand by the exact amount of heat transferred.
- Do not use hot utility below the pinch point: Since the region below the pinch already has a net heat surplus, adding external heat forces the cooling system to work harder, increasing energy waste.
- Do not use cold utility above the pinch point: Because the region above the pinch has a heat deficit, using cooling utilities in this zone wastes thermal energy that could have been recovered, driving up the fuel consumption of the boilers.

Identify where your plant is losing energy and quantify the savings potential — our audits map every heat source, sink, and waste stream in your facility.
Mathematical Targeting with the Problem Table Algorithm
While graphical composite curves provide excellent visualisation, designing complex networks requires a precise mathematical approach. The Problem Table Algorithm, developed by Linnhoff and Flower, eliminates graphical inaccuracies by using algebraic formulations to calculate the exact pinch temperature and utility targets.
Establishing the Minimum Temperature Approach (ΔTmin)
Before initiating calculations, engineers must select the minimum temperature approach (ΔTmin). This value represents the smallest temperature difference acceptable for heat transfer within the heat exchangers. Choosing ΔTmin is an economic optimisation process:
- A small ΔTmin (e.g., 5°C) maximises heat recovery and minimises utility costs but requires significantly larger heat exchanger surface areas, which increases capital expenditure.
- A large ΔTmin (e.g., 20°C) reduces the required surface area and capital cost but increases external fuel and cooling water consumption.
Typical values of ΔTmin range from 10°C to 20°C in chemical processes and 5°C to 10°C in low-temperature refrigeration systems.
Enthalpy Calculations for Process Streams
The heat load (Q) for each stream in a process interval is calculated using the steady-state thermal energy equation:
Q=F⋅Cp⋅(Ttarget−Tsupply)Where:
- Q is the thermal load of the stream (expressed in kW)
- F is the mass flow rate of the process fluid (expressed in kg/s)
- Cp is the specific heat capacity of the fluid at constant pressure (expressed in kJ/kg·K)
- Ttarget is the final temperature required by the process (expressed in °C)
- Tsupply is the initial temperature of the fluid entering the network (expressed in °C)
Process engineers compile these individual stream parameters during the initial data extraction phase of the energy audit.
A Sample Process Stream Data Extraction
To illustrate the data extraction process, process engineers collect stream characteristics from process flow diagrams and mass-energy balances. The following table represents a typical four-stream system used to initiate the Problem Table Algorithm.
| Stream ID | Stream Classification | Supply Temperature (°C) | Target Temperature (°C) | Heat Capacity Flowrate (kW/K) | Enthalpy Change (kW) |
|---|---|---|---|---|---|
| H-101 | Hot | 180.0 | 60.0 | 30.0 | -3600.0 |
| H-102 | Hot | 150.0 | 40.0 | 15.0 | -1650.0 |
| C-201 | Cold | 30.0 | 130.0 | 20.0 | 2000.0 |
| C-202 | Cold | 80.0 | 160.0 | 40.0 | 3200.0 |
Using this data, the algorithm shifts the temperatures of the hot and cold streams by subtracting or adding half of the ΔTmin value. This shift allows the streams to be placed on a shared temperature scale, enabling the calculation of heat surpluses and deficits within defined temperature intervals.
Constructing the Grand Composite Curve
Once the heat cascade is calculated algebraically, the data is plotted to form the Grand Composite Curve (GCC). The GCC displays the net heat surplus or deficit of the process as a function of temperature. This curve is an essential tool for utility selection. It indicates not only how much external energy is needed but also the temperature levels at which this energy must be supplied. This allows utility engineers to match process demands with the most cost-effective utility streams, such as low-pressure steam instead of high-pressure steam.
Integrating Heat Pumps and Utilities Across the Pinch

Optimising a process often involves more than just configuring simple liquid-to-liquid heat exchangers. High-efficiency utility systems, such as industrial heat pumps and combined heat and power plants, must be integrated correctly relative to the pinch point to deliver real utility savings.
Thermodynamic Logic of Heat Pump Placement
A heat pump is a thermal device that absorbs heat at a lower temperature, uses mechanical work (electricity) to elevate the temperature of that heat, and rejects it at a higher temperature.
A foundational rule of process integration is that heat pumps must work across the pinch point to achieve thermodynamic utility reduction:
- The evaporator must absorb heat from below the pinch point, where there is an excess of process heat.
- The compressor elevates the temperature of this captured heat.
- The condenser rejects this upgraded heat above the pinch point, where the process has a thermal deficit.
This configuration directly reduces both the hot utility and cold utility demands of the plant.
Operating Across the Pinch Point
Integrating a heat pump entirely above or below the pinch point is thermodynamically ineffective. If placed completely above the pinch, the heat pump absorbs heat from a region that is already in deficit and rejects it to the same region. This reduces the hot utility load by the amount of electricity supplied to the compressor, but since electricity is far more expensive than thermal energy, the operational economics are highly unfavourable. If placed completely below the pinch, the heat pump absorbs heat from a surplus region and rejects it to a surplus region, which does not reduce the external fuel demand of the boilers.
Selecting and Optimising Utility Streams
By using the Grand Composite Curve, process engineers can identify opportunities to replace expensive utilities with cheaper alternatives. For example, instead of using high-pressure steam (supplied by high-temperature fuel combustion) for all heating duties above the pinch, the GCC reveals where lower pressure steam or hot water cascades can be utilised. This reduces the fuel consumption of the boilers and maximises the thermal efficiency of co-generation plant operations.

Identify where your plant is losing energy and quantify the savings potential — our audits map every heat source, sink, and waste stream in your facility.
Pinch Analysis in Compliance-Driven UK Audits (ESOS Phase 4)
In the United Kingdom, large organisations are legally required to participate in the Energy Savings Opportunity Scheme (ESOS). This mandatory quadrennial audit scheme is designed to identify cost-effective energy savings and reduce carbon emissions across industrial processes, transport, and buildings.
Meeting ESOS Phase 4 Industrial Audit Guidelines
For organisations qualifying under ESOS Phase 4, the compliance framework has become significantly more rigorous than in previous cycles. Key developments in Phase 4 include:
- The Qualification Date: Status as a large undertaking is determined based on company data on 31 December 2026.
- The Submission Deadline: The final notification of compliance must be submitted to the Environment Agency by 5 December 2027.
- Energy Coverage Expansion: The minimum energy auditing threshold has been raised to 95% of total energy consumption, up from 90% in Phase 3.
- Mandatory Action Plans: Qualifying companies must submit a formal, board-signed action plan detailing how they will implement energy-saving recommendations, with progress tracked in annual updates.
In compliance-driven audits like Phase 4, pinch analysis functions as a critical thermodynamic framework to mathematically identify minimum hot and cold utility targets before physical equipment modification.
The Role of Detailed Thermal Mapping in Compliance
Because Phase 4 has removed standard options like Green Deal Assessments and Display Energy Certificates for compliance, industrial operators must rely on detailed, high-quality audits. Pinch analysis provides the necessary quantitative rigour by creating detailed thermal energy balances and process heat maps. It translates raw mass and energy balances into verified, audit-ready thermal efficiency targets, ensuring that ESOS submissions are backed by sound physics rather than generic estimations.
Synergising with Long-Term Energy Management Systems (BS EN ISO 50001:2018)
Organisations that maintain a certified BS EN ISO 50001:2018 energy management system across all their operations are exempt from standard ESOS audits, though they must still submit a summary report. Incorporating pinch analysis into a BS EN ISO 50001:2018 framework establishes clear Energy Performance Indicators (EnPIs). By continuously comparing the actual thermal energy use of a plant against the pinch targets, energy managers can identify process drift, measure heat exchanger fouling, and systematically schedule maintenance activities to sustain high efficiency.
Industrial Case Studies: Chemical, Paper, and Pharmaceutical Sectors

Energy-intensive manufacturing sectors present the greatest opportunities for process integration. By applying pinch analysis to complex heat exchanger networks, facilities in these sectors typically reduce primary thermal energy demands by 15% to 30%.
Speciality Chemical Processing Heat Integration
Chemical plants are characterised by complex preheat trains, distillation columns, and reactor feed-effluent loops. In a speciality chemical facility in northern England, a detailed pinch assessment mapped the thermal interaction of several distillation columns and reaction stages.
The analysis revealed that high-temperature reactor effluent was being cooled by cooling water below the pinch, while the distillation reboilers above the pinch were relying entirely on high-pressure steam. By reorganising the heat exchanger network, engineers redirected the hot reactor effluent to preheat the distillation column feed. This modification reduced the site's overall steam consumption by 22%, resulting in substantial annual energy cost savings and a significant reduction in Scope 1 carbon emissions.
Pulp and Paper Thermal Cascade Optimisation
The paper industry consumes large quantities of low-grade steam to dry paper sheets and concentrate black liquor in multi-effect evaporators. In a UK-based paper mill, a pinch integration project analysed the steam distribution network.
The audit team constructed a Grand Composite Curve, which revealed that low-grade flash steam from the paper machine hood dryer could be condensed to supply heat to the vacuum evaporator train. This adjustment eliminated the need to use primary, high-pressure boiler steam for evaporator heating. The cascade optimisation cut the mill's total thermal demand by 28%, significantly lowering fuel costs and decreasing the plant's dependency on imported natural gas.
Pharmaceutical Batch Process Heat Recovery
Pharmaceutical manufacturing often relies on batch operations, where reactors are heated and cooled sequentially rather than continuously. This time-dependent operation presents a unique challenge for standard heat integration, as hot and cold streams do not always flow simultaneously.
To resolve this, engineers utilise multi-period pinch analysis. In a secondary manufacturing facility in the Midlands, engineers mapped the scheduling of batch reactions alongside the thermal profiles of heating and cooling cycles. By integrating a pressurised hot water thermal storage loop, the system captured excess heat from the exothermic reaction stages, stored it, and discharged it to preheat subsequent batch ingredients. This thermal buffer reduced the site’s clean utility steam consumption by 17% and substantially decreased the cooling load on the chilled water systems.
System Implementation: From Analysis to Physical Network Modification
Transitioning from a thermodynamic model to physical hardware requires careful consideration of real-world operational constraints. Process engineers must ensure that energy saving modifications do not compromise plant safety, product quality, or operational flexibility.
Overcoming Controllability and Safety Constraints
Highly integrated heat exchanger networks couple different process units together. While this coupling reduces energy consumption, it can make process control more complex. A disturbance in one part of the plant can easily propagate to other units through the shared heat exchangers.
To mitigate these risks:
- Process engineers routinely use dynamic process simulation software to model control system responses.
- Bypass lines and control valves are installed to allow operators to isolate individual heat exchangers during startup, shutdown, or upset conditions.
- Physical separation is maintained where cross-contamination risks are present, such as separating clean pharmaceutical utility streams from active chemical process fluids.
Integrating Ecolog Consumption Monitoring for Continuous Verification
The calculated energy savings of a pinch design are only realised if the system is maintained in its optimal operating state. EnerTherm Engineering integrates pinch analysis with the Ecolog consumption monitoring platform, identifying process optimisation opportunities to bridge the gap between design and long-term operation. Operating as a read-only system with a unidirectional data flow that cannot write back to the PLC, the Ecolog system continuously collects flow and temperature data from key points across the heat exchanger network. By feeding these live measurements into a digital process model, the platform tracks real-time heat transfer coefficients and identifies fouling or scaling on heat transfer surfaces. This active monitoring provides predictive maintenance recommendations, enabling operators to schedule actions during validated change windows, ensuring that the network consistently achieves its targeted 15% to 30% thermal reduction without experiencing performance degradation over time.
Balancing Capital Expenditure Against Energy Savings
Implementing process integration involves a clear trade-off between the cost of new heat exchangers, piping, and civil works (capital expenditure) and the subsequent reduction in utility bills (operating expenditure). A successful project focuses on identifying the highest-yielding modifications. Often, the most cost-effective approach is not to build a completely new network, but rather to make targeted retrofits. By modifying or adding just one or two strategically placed heat exchangers, plants can often secure 80% of the maximum theoretical savings with a fraction of the capital investment, achieving payback periods of less than two years.
This article reflects the independent analysis and editorial opinion of EnerTherm Engineering. Product names, trademarks, and brands mentioned belong to their respective owners. EnerTherm Engineering is not affiliated with, endorsed by, or a licensee of any third-party software or product mentioned unless explicitly stated.

Managing Director — EnerTherm Engineering
Dr. François Pierrel is Managing Director of EnerTherm Engineering with over two decades of expertise in thermal design, heat transfer, and industrial energy optimisation. He holds a PhD in Heat Transfer from Cranfield University and a Post-Doctorate from Heriot-Watt University.
