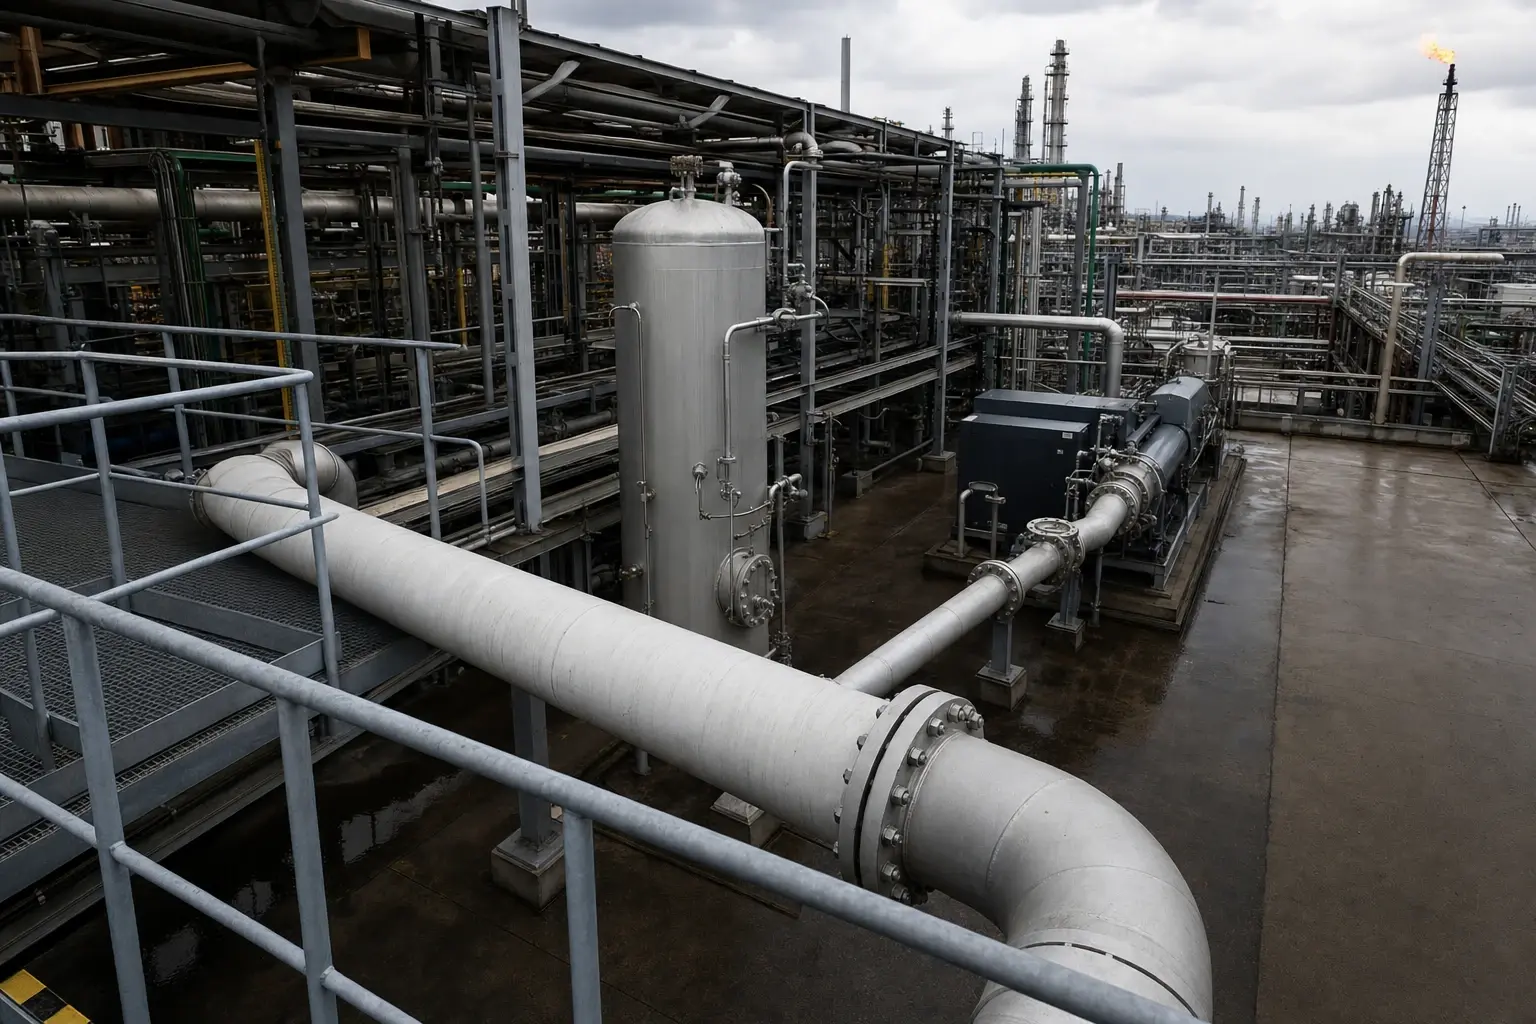
// IMAGE_UNAVAILABLERefinery Flare Gas Recovery Analysis: What HMB Reveals1690[Heat & Mass Balance for Oil Refining]Refinery Flare Gas Recovery Analysis: What HMB Reveals400 kg/h of refinery flare gas can yield 2,900 toe annually. See how HMB analysis quantifies fuel-gas recovery, LHV and CO2 emissions savings.// August 24, 2026Open →
// IMAGE_UNAVAILABLEPinch Analysis for Heat Exchanger Networks: 10-35% Savings1689[Energy Audit for Chemical Processing]Pinch Analysis for Heat Exchanger Networks: 10-35% SavingsPinch analysis identifies 10-35% energy-saving opportunities in chemical heat exchanger networks before retrofit design.// August 24, 2026Open →
// IMAGE_UNAVAILABLEPharmaceutical Utility System Design After Annex 11688[Heat & Mass Balance for Pharmaceutical]Pharmaceutical Utility System Design After Annex 1EU GMP Annex 1 sections 6.7-6.17 define WFI, purified water and clean steam design controls for sterile manufacture since August 2024.// August 24, 2026Open →
// IMAGE_UNAVAILABLEHow Distillation Column Optimisation Cuts Utility Demand1687[Heat & Mass Balance for Chemical Processing]How Distillation Column Optimisation Cuts Utility DemandCut distillation utility demand by 20-60% using reflux optimisation, heat integration and validated simulation-led operating targets.// August 21, 2026Open →
// IMAGE_UNAVAILABLESteam Header Reconciliation Exposes Turbine and PRV Losses1686[Heat & Mass Balance for Paper & Pulp]Steam Header Reconciliation Exposes Turbine and PRV LossesSteam header reconciliation tracks turbine extractions, PRV bypasses and condensate returns to expose fuel loss and missed power generation.// August 21, 2026Open →
// IMAGE_UNAVAILABLEWhy the Organic Rankine Cycle Pinch Point Sets Power Output1685[Pinch Analysis for Power Generation]Why the Organic Rankine Cycle Pinch Point Sets Power OutputORC pinch points of 20 K and 5 K set heat recovery, source cooling and net power output - balance approach temperature with exchanger area.// August 20, 2026Open →