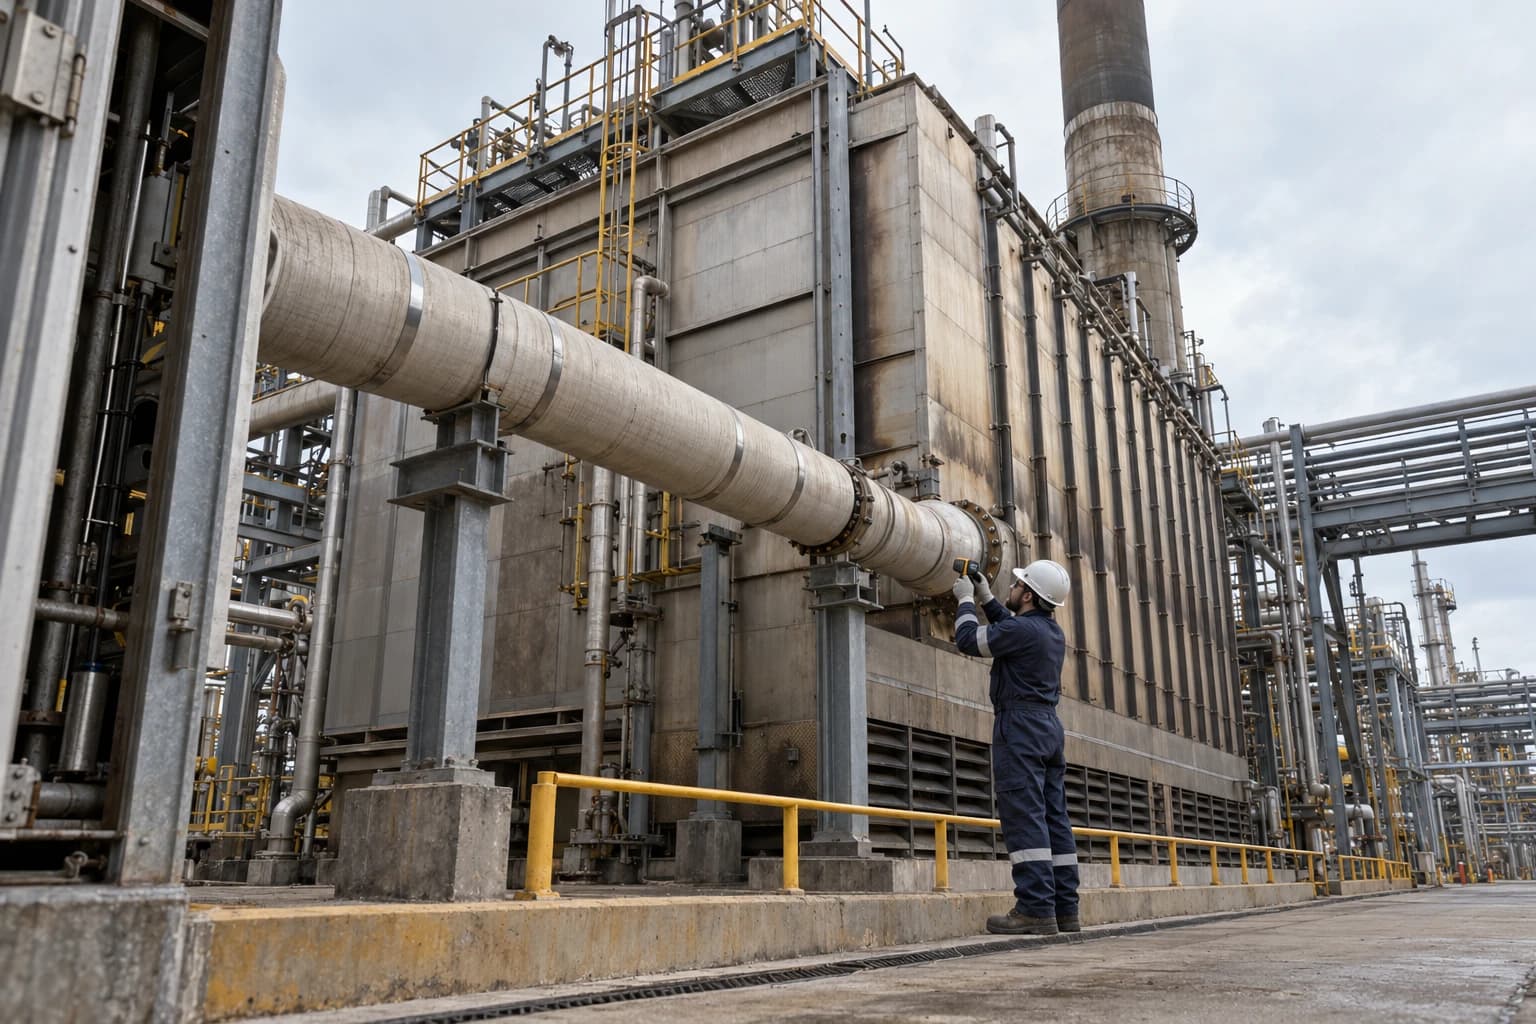
// IMAGE_UNAVAILABLERefinery Pinch Analysis Tests Heat Recovery Before FEED1803[Heat & Mass Balance for Oil Refining]Refinery Pinch Analysis Tests Heat Recovery Before FEEDRefinery pinch analysis sets heat recovery targets before FEED, helping cut fired-heater fuel, cooling duty and emissions despite fouling.// October 19, 2026Open →
// IMAGE_UNAVAILABLEWhy 6-12% Heat Savings Can Mislead Chemical Plant ROI1802[Energy Audit for Chemical Processing]Why 6-12% Heat Savings Can Mislead Chemical Plant ROIDESNZ models 6-12% heat savings and £2m CapEx, but chemical plant ROI depends on real utility demand, operating hours, energy penalties and risk.// October 19, 2026Open →
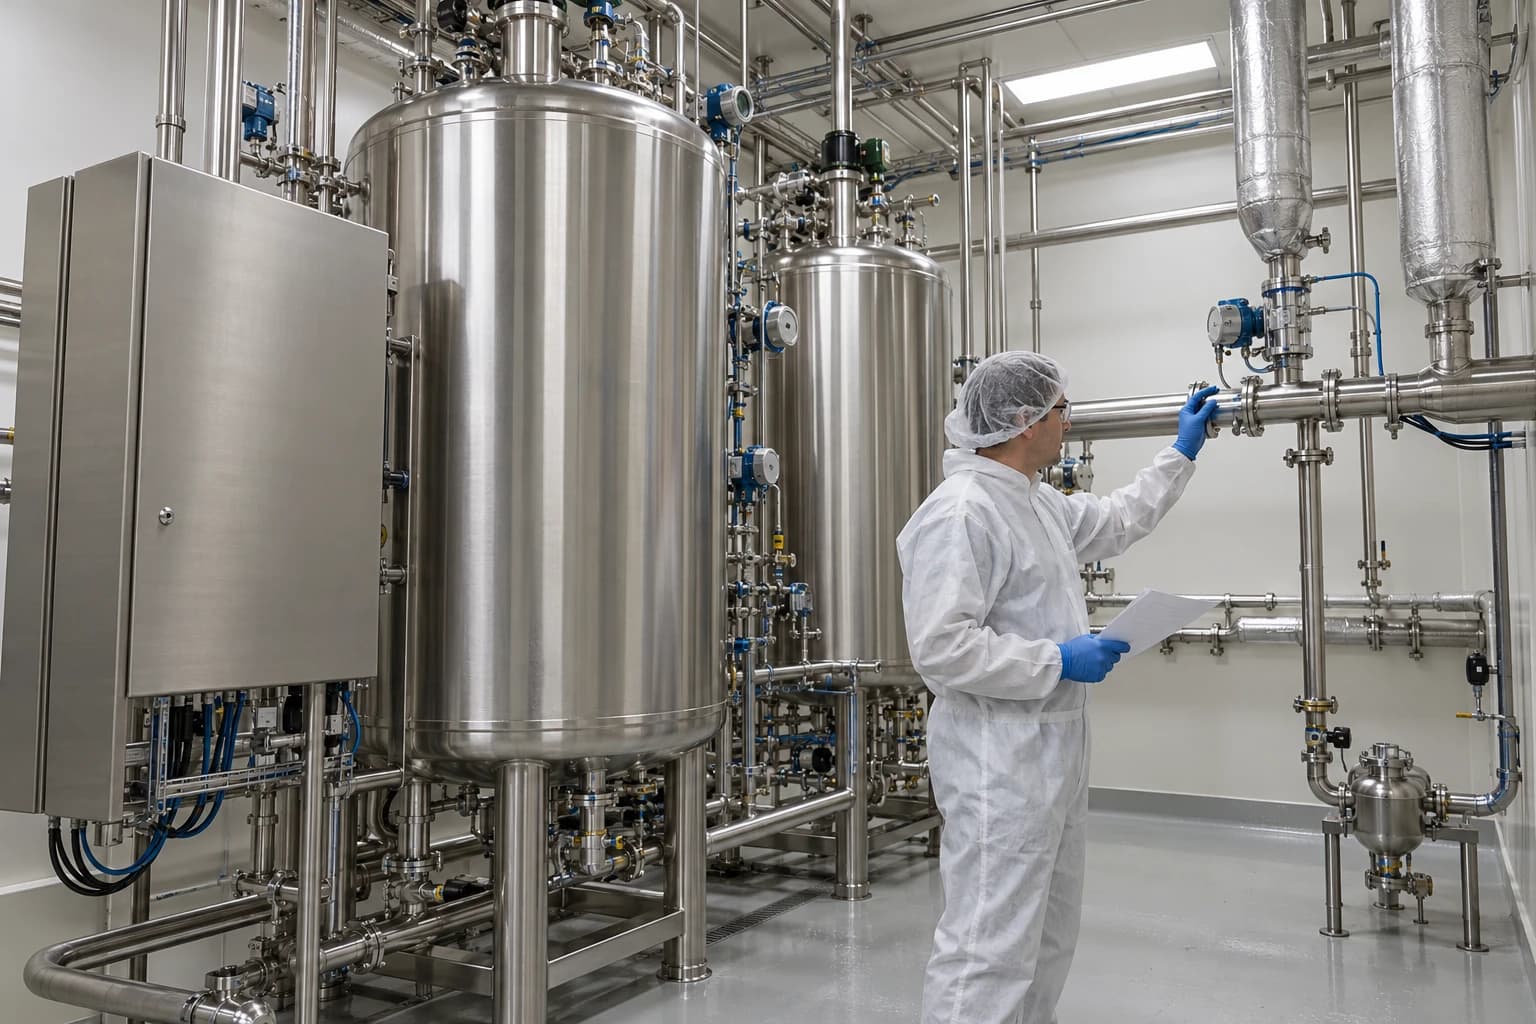
// IMAGE_UNAVAILABLEGMP Compliant Process Validation After Utility Changes1801[Heat & Mass Balance for Pharmaceutical]GMP Compliant Process Validation After Utility ChangesEU GMP Annex 15 utility changes require risk-based requalification. See how heat and mass balance evidence sets process validation scope.// October 19, 2026Open →
// IMAGE_UNAVAILABLEWhy P&ID Simulation Validation Must Precede Modifications1800[Heat & Mass Balance for Chemical Processing]Why P&ID Simulation Validation Must Precede ModificationsValidate P&ID simulations in 11 steps before plant modifications, reconciling control loops, trips and heat duties with as-built records.// October 16, 2026Open →
// IMAGE_UNAVAILABLEEnergy Audit for Pulp and Paper Mills: 5 BAT Checks1799[Heat & Mass Balance for Paper & Pulp]Energy Audit for Pulp and Paper Mills: 5 BAT ChecksIdentify verified energy losses with a pulp and paper mill energy audit: 5 BAT checks for steam, dryers, recovery and water systems efficiency.// October 15, 2026Open →
// IMAGE_UNAVAILABLEGrand Composite Curve Utility Selection: Steam Levels1798[Pinch Analysis for Power Generation]Grand Composite Curve Utility Selection: Steam LevelsGrand Composite Curve utility selection identifies feasible steam levels around the pinch and cuts high-grade steam use in process plants.// October 15, 2026Open →